Purtroppo oggi 19 settembre 2020, la mia gatta, Scruppy ci ha lasciato.
Erano mesi che soffriva di una patologia non curabile.
Accompagnarla dal veterinario per l’ultimo saluto alla vita è stato difficile, un passaggio obbligato per lenire la sua sofferenza ma che ne ha generata tanta nel mio cuore.
Come ogni gatto aveva un carattere schivo e un po’ ribelle che si è addolcito negli anni.
Dava il meglio di se tra gli alberi ed in particolare quando ferma sul ciliegio o sul fico poteva controllare il mondo dall’alto.
Ma il ricordo per me più bello è legato al quotidiano ritorno a casa dal lavoro.
Scendevo dall’auto e sulla finestra della cucina vedevo la mia gatta che mi dava il bentornato facendosi dolcemente accarezzare salutandomi con delle rumorose fusa
Scruppy, grazie di essere stata parte della mia vita.
Last month, a partner had to face up a strange VBR behavior.
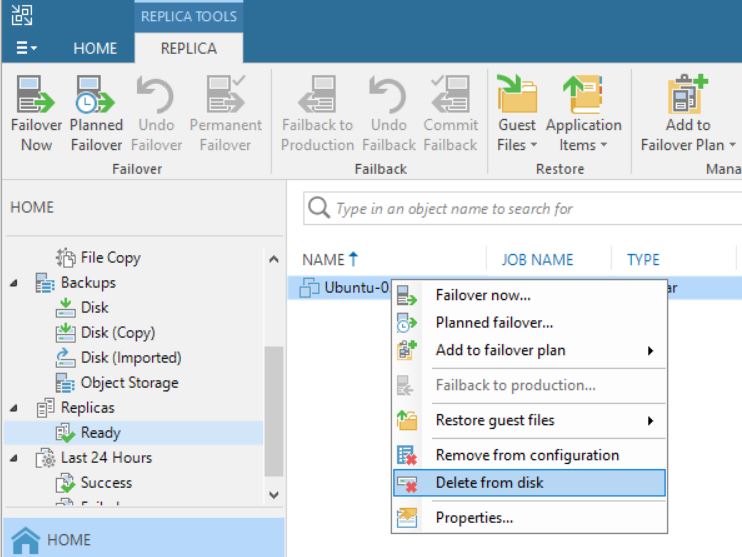
From the VBR console he deleted a VM’s replica (Picture 1), and suddenly the production VM has been also erased (don’t worry, before doing any activity he tested the backups using sure backup technology).
Picture 1
The reason why it happened become clear to me once I read the logs.
To do it shortly, some weeks before someone started a Failover directly from vCENTER console without doing any communication to the internal IT team.
This article wants to explain how to avoid this common mistake.
The first step is understanding some basic concepts:
a) VMware identify any single VM with a number named MorefID and a UUID.
b) Any single operating system has an identifier named Instance UUID (Universal Unique IDentifier); in my lab, I set-up more than one replica job for a single VM
Table 1. row 2. shows the name of production VM (Ubuntu-02), its morefID (vm2270), where it is running (Milan), the UUID (…bcc12) and its VM UUID … f58b.
Table 1. row 3-4 shows the name of VMs replicas, morefID, instance UUID and its UUID.
All tables shown in these articles have been created using Veeam One
Name
PCName
morefID
DataCenter
Instance UUID
UUID
Ubuntu-02
ubuntu-02
vm-2270
Milan
502d2405-cc8f-de73-1a19-57e8496bcc12
564d013a-7835-9d1b-841e-32855790f58b
Ubuntu-02_Rep_VC01
ubuntu-02
vm-2694
Milan
502d2d90-d08f-08aa-efcf-d9feaa1d13f8
564d013a-7835-9d1b-841e-32855790f58b
Ubuntu-02_Rep_VCDR
ubuntu-02
vm-399
Venice
501d517b-672e-30e0-665a-fd4b4af7dcb6
564d013a-7835-9d1b-841e-32855790f58b
Table-1
Picture 2 shows the VM source (highlighted in yellow) from vCENTER console.
Picture 2
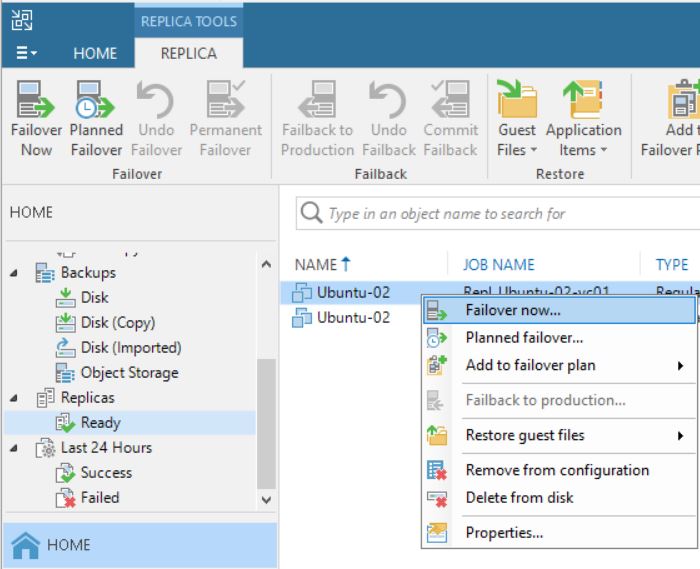
After checking up that the VM source is switched off, it’s possible to start a Failover (Picture 3).
Picture 3
The next five pictures show the step-by-step wizard to complete the procedure correctly. As you can see from picture 4 the VM that has been replicated with two different jobs (Picture 5) is always Ubuntu-02.
Picture 4
Picture 5
Pictures 6-8 show the result of the failover.
Picture 6
Picture 7
Picture 8
What happens when you complete the task with the Permanent failover? (Picture 9/10/11)
Picture 9
Picture 10
Picture 11
First of all, comparing picture 3 with 12 it is possible to see that one of the Replica Ready VM, and precisely the VM in permanent failover, has been deleted.
Picture 12
Picture 13 shows that now the replica job contains 0 objects. The right behavior is confirmed by pictures 14,15,16 and 17 where it is shown that the replica is not available anymore.
Picture 13
Picture 14
Picture 15
Picture 16
Picture 17
The cloning job option didn’t change the correct behavior (Pictures 18 and 19)
Picture 18
Picture 19
Let’s sum up. Following the right procedure, the Failover works as aspected
Now …. why the VM has been deleted? The next article will explain it in detail.
My previous article explained the procedure to perform a failover from VBR console explaining why it is safe (Click here to read it)
In this second article, I’ll show you what can happen if you try a failover in a different way, answering the behavior that a partner had during a cleanup procedure.
In my lab, I created a new Replica Job where the original VM is still Ubuntu-02 (Picture 1) and the replica VM has the suffix _Rep_vc01-1-1 (Picture 2).
Picture 1
Picture 2
After the VM has been created (Picture 3) It is switched it on directly from the vCENTER console (Picture 4). To be sure it works as expected, it is possible to connect remotely.
Picture 3
Picture 4
Picture 5
Going back to VBR console it’s possible to see that nothing has changed (Picture 6) just because the power-on action has been performed directly from the VMware console,
Picture 6
Attention point: If you try to perform a replica task it fails because the VM is running (picture 7)
Picture 7
Now the main point of the two articles:
It’s a bad choice to delete VMs from VBR “Ready Replica VM” menu (picture 8/9) without knowing if the VMs have been started from vCENTER console. Why? Because also the production VM gets deleted as shown in picture 10.
Picture 8
Picture 9
Picture 10
Let’s get a little wild with some supposing:
1. If you see the “active” status icon switched on ( from VBR console) it means the failover is started (picture 11)
Picture 11
2. If a permanent failover was performed, the VM disappears from “Replica Ready” menu and replica job results to be empty (Picture 12)
Picture 12
3. If the replica job works fine it means that no permanent failover has been performed
4. If the replica Job works fine but when clicking on the delete button (from “Replica ready menu” of VBR console) (picture 13) the production VM disappears, it means that a new replica job has been re-created after the manual failover has been launched (picture 14).
Picture 13
Picture 14
Knowing that deleting a VM replicated from VBR console needs a little attention, especially if you do not have the continuous and complete control of the VMware architecture, the question is: is it possible to think an easy checking-up before deleting VM?
The answer is Yes and Veeam One can easily help just creating them.
a. From vCENTER: setting up a report that checks if the VM to be deleted is running (power state status) (Table 1)
b. From VBR: if a Replication job is setted-up for that VM (Table 2)
Table 1
Table2
Is there another way to check it up?
Yes. using Powershell scripts.
The example you can find here below is just the first idea that can be polished with a little bit of your effort.
NB1:I’m not a PowerShell expert, I just love writing scripts easy to read by anyone.
NB2: Before trying it please ask your PowerShell expert a consultant!
NB3: It is meant to be launched from VBR.
NB4: If you think that it can be a feature request write to me!
This topic needs an awfully long time to be rightly covered. For this reason, I wrote 5 articles.
The first two will explain the base concepts in front of technology. The others will cover how to set up VDrO for managing the Veeam Replica job, the Veeam Backup job, and the Netapp Storage Replica.
In these articles, I will not manage how to install VDO software; please refer to the deployment guide (VDrO Guides).
VDrO – Baseline-1:
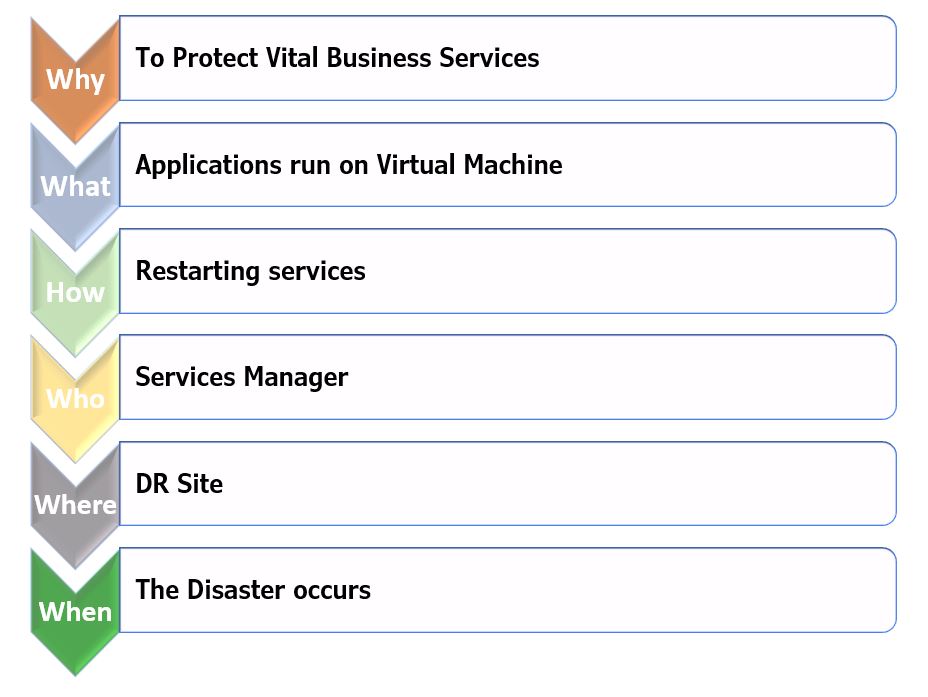
One of the common requirements of big companies is to automatically manage Disaster Recovery.
Let’s see the decisional process of the IT Manager
These are the VDrO answers.
Let’s move to the VDrO console:
The first steps after logging in (picture 1) is to click on the administrator tab (Yellow on picture 2) and check the license file installed (picture 3)
Picture 1
Picture 2
Picture 3
Now I’m going to describe the structure of the software components.
VDrO Server: it shows where the VDrO Server has been installed (Picture 4)
Picture 4
The VDrO architecture is well-represented in picture 5 where three production sites replicate their data to a DR site.
Picture 5
Is it important to fill up the VDrO Server form? Yes, because VDrO creates automatically the DR- Plan documentation.
In my lab, I have just a production site and a DR site.
VDrO AGENTS: to control the activities of the Backup Server located in production sites, VDrO installs his own agent. The installation task is performed directly from the VDrO console (Picture 6).
Picture 6
vCENTER SERVERS: in my scenario, there are two vCenters; the first one in production and the second in DR site (Picture 7).
(Picture 7)
STORAGE SYSTEM: the most important VDrO news is the integration with storage replication technology. This version supports just Netapp. Picture 8 shows how to add the Storages to VDrO.
Picture 8
The last VDrO article will deal with how to set up and use this great technology.
RECOVERY LOCATION: it’s the place where the DR will be performed (Picture 9). It can be different locations in respect to where VDrO is installed.
Picture 9
In the next rows and pictures, I’ll show which info VDrO needs to work at its best.
In particular, I’m talking about the resources present in the recovery location. In this example the computer resources (Picture 10) and storage resources (picture 11).
Picture 10
Picture 11
The next 10 rows are very important to fix in mind.
How the VDrO can understand which resources are available? In other words, how can I assign resources to my Failover Plan?
The answer is VDrO uses massively tagging to all resources present at the VMware level.
Tagging means that resources can be added to VDRO
But …. is it possible to tag the resources?
Yes, It’s possible because inside VDrO there is the Veeam ONE Business-View component that can be freely used to tag resources.
To have more details about tagging please refer to theVDrO-guide.
One of the most common requests from the customers is to create automatic documentation about failover for both testing and procedures.
VDrO has already templates (in different languages that you can personalize at will) that are automatically filled up from software when you test or perform the Disaster Recovery.
In the next two pictures, it is shown how to set up an e-mail subscription (Picture 12) and configure the report Detail level (Picture 13).
Just remember to subscribe to the report to the right scope.
(Picture 12)
(Picture 13)
The next option is the reason why I fell in love with VDrO (Picture 14).
(Picture 14)
As you can see there is a big choice with DR plan steps. What does it mean?
Let’s see it with an easy example:
My DR plan requires switching on the Domain Controller (VM1) and afterward the SQL Application (VM2).
I want also to be sure that
a. the original VMs are switched off before starting the DR plan
b. when DR-plan is up and running, the SQL application has to answer port 1433.
What the VDrO can do for you?
With the pre-plan step, you can check the original VMs are switched off.
With a post-plan, you can check that the application answers correctly.
Another great point about plan steps is that you can choose if the actions have to be executed or skipped. In this way, it adds more flexibility to the solution.
(Picture 15)
Picture 16
It’s time to have a break. My next Article (VDrO – Baseline 2) will show scopes and plan components.
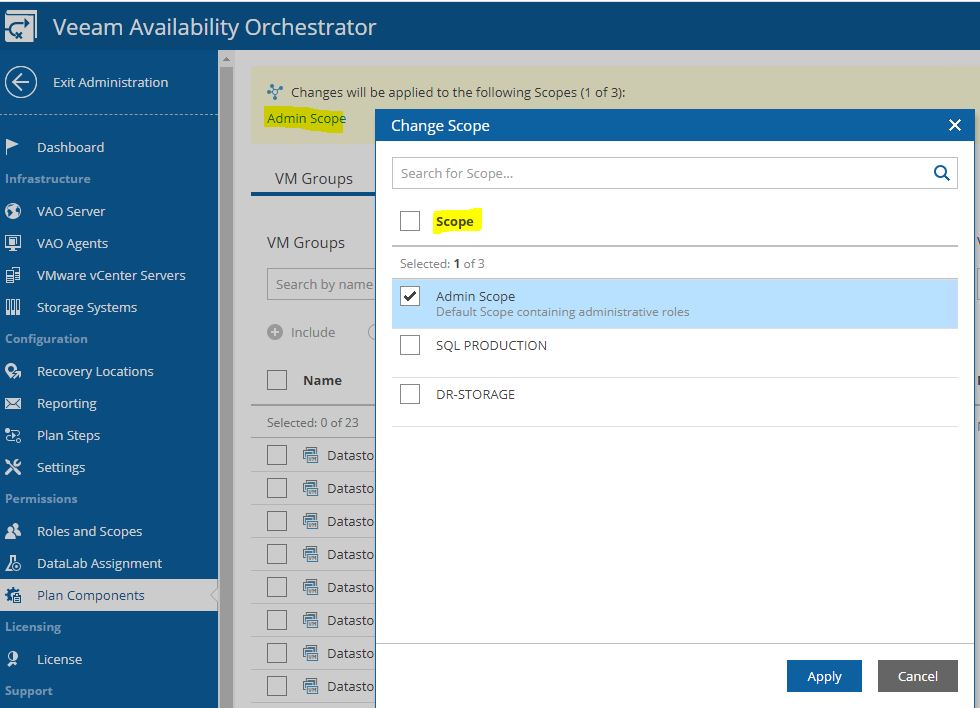
Let’s continue the VDrO features description talking about scope (Picture 1).
Picture 1
The VDrO controls access to its functionality with the scopes.
A scope defines which operations users can perform.
Let’s back to my example, I created a SQL Production scope where only the users belonging to the SQL administrator group can manage and launch the DR process.
The plan components are probably the main VRrO attention point (Picture 2).
(Picture3)
From this menu, it’s possible to group as a single entity all objects you need to create a Disaster Recovery strategy.
I’m talking scope (first to select), VM (applications and services), recovery locations, plan steps, credentials, and jobs template.
To be clearer, it’s like creating a picnic basket and putting it inside different dishes.
Now you just have to lay the table.
How to do it? (Which dishes do I have to put into the basket?)
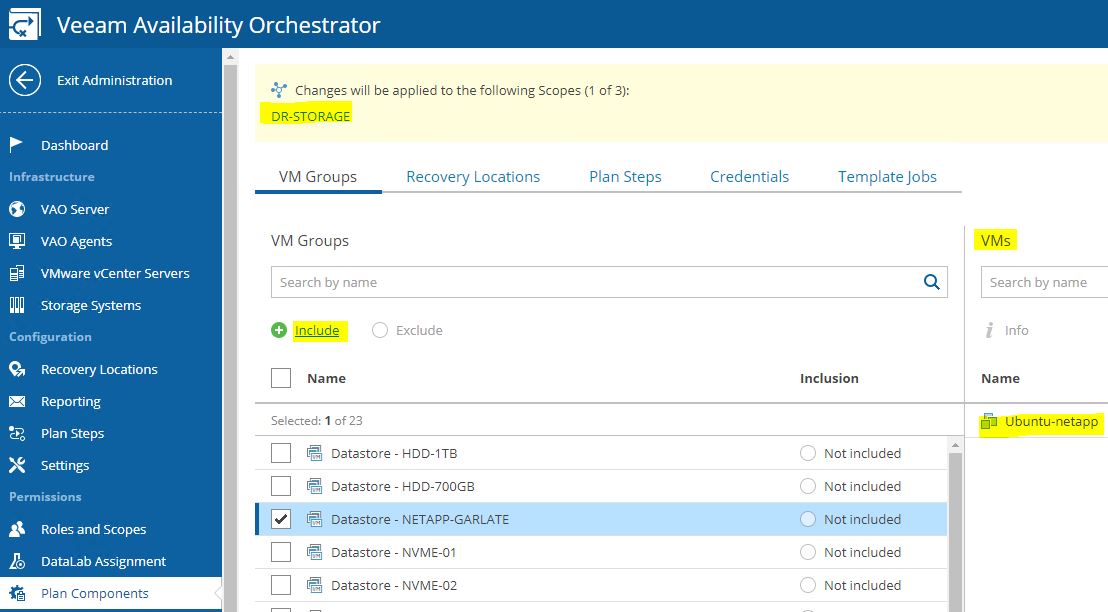
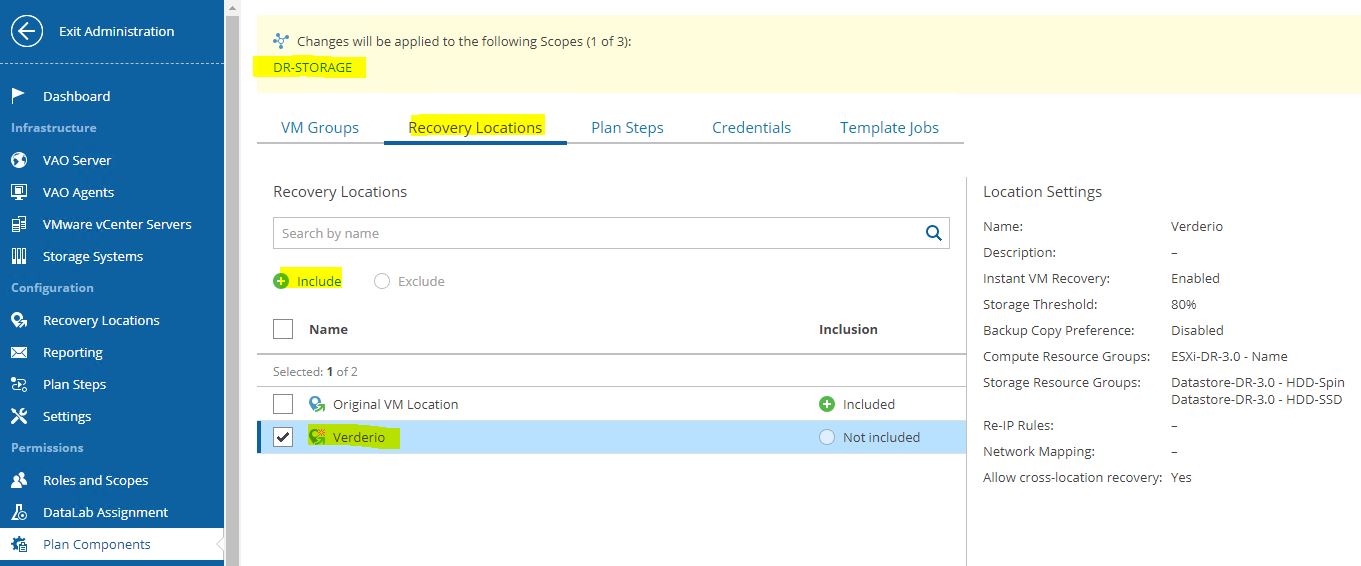
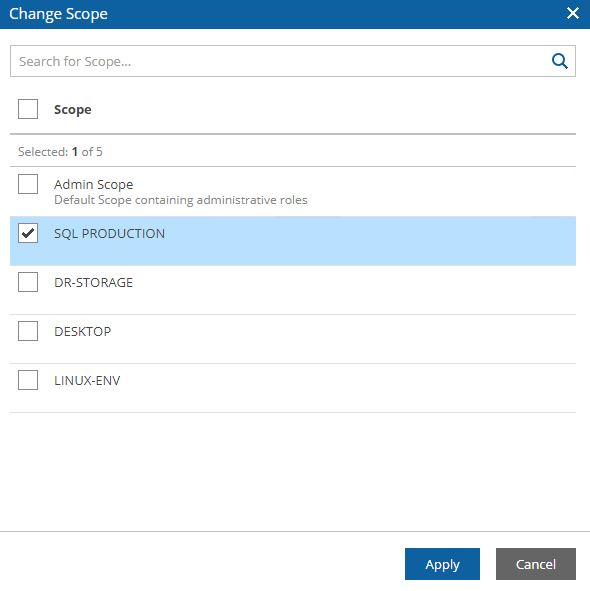
Just select scope (Picture 4), then from VM groups include the needed VMs source (Picture 5), from recovery locations, select the DR site (picture 6), and at the end select plan steps, credential, and Template Job.
Picture 4
Picture 5
Picture 6
The last point is the DataLabs assignment but I’m sure you can now include them on the right scopes.
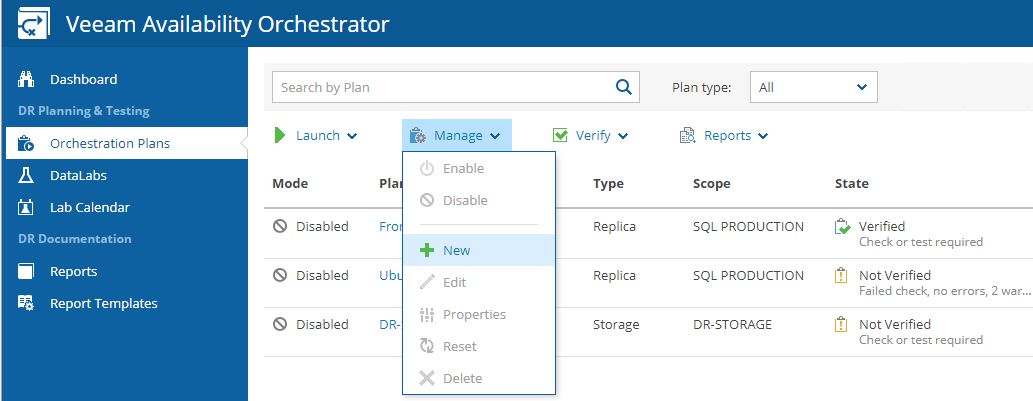
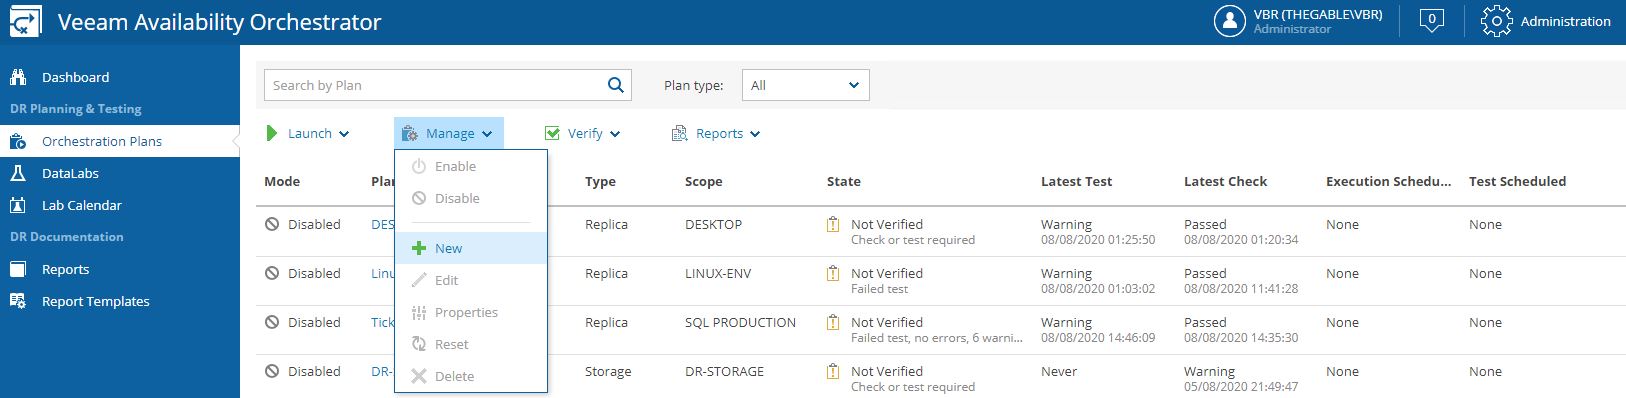
Exit from the Administrator menu and move to the main menu to create the first Recovery Plan.
The wizard is very easy to be used:
Picture 7
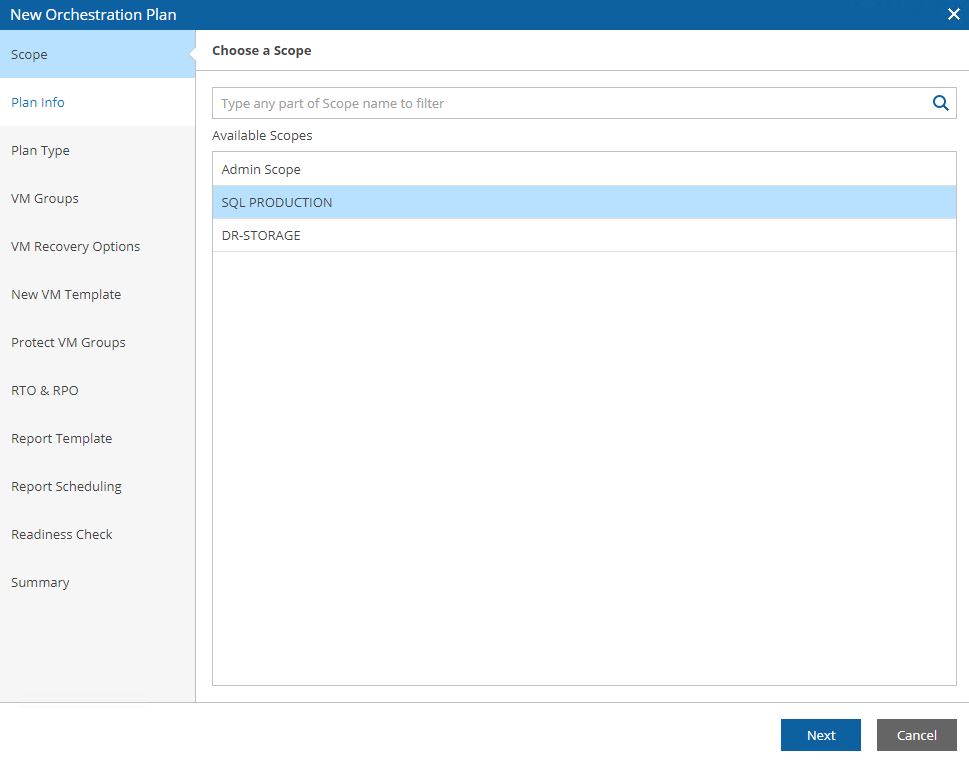
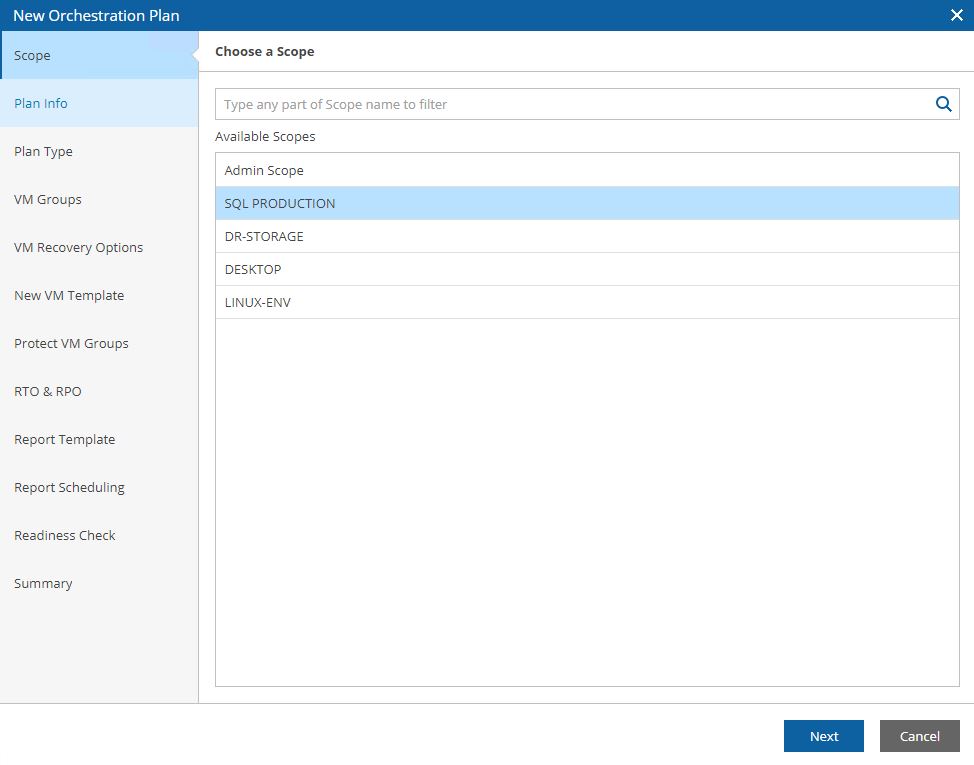
Picture 8 shows how to select the Scope.
Picture 8
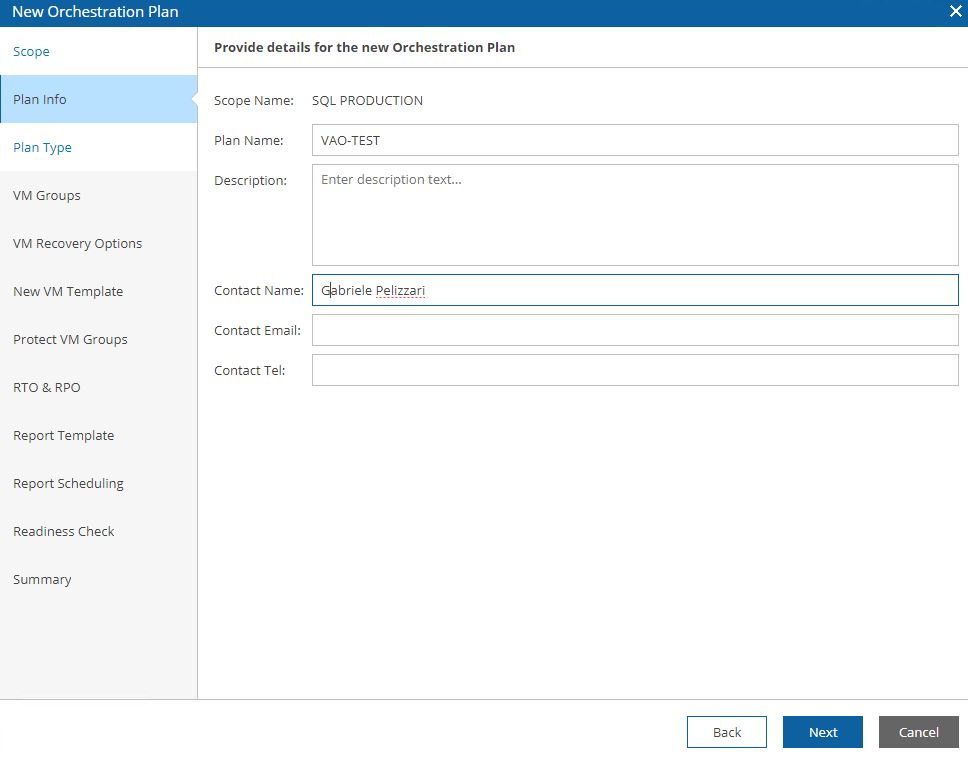
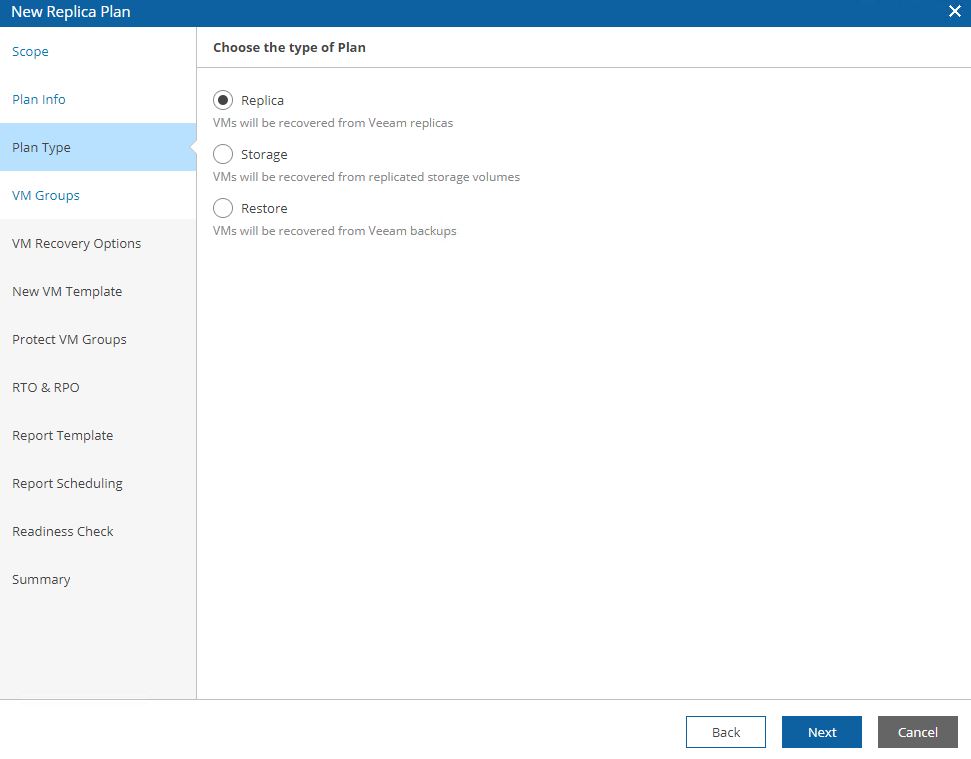
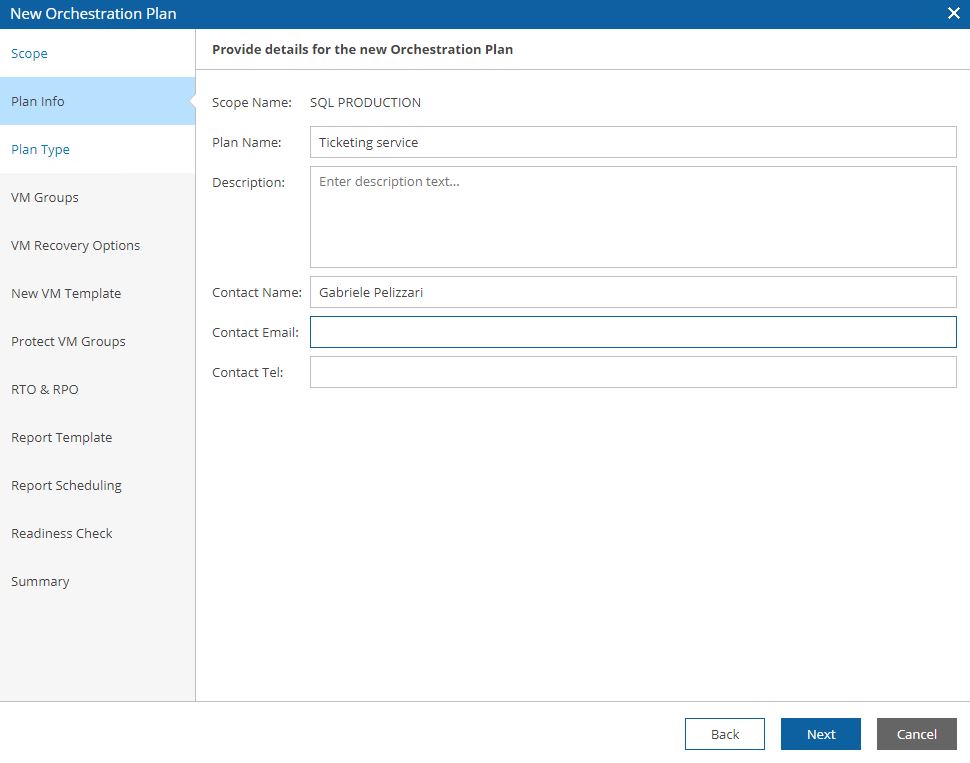
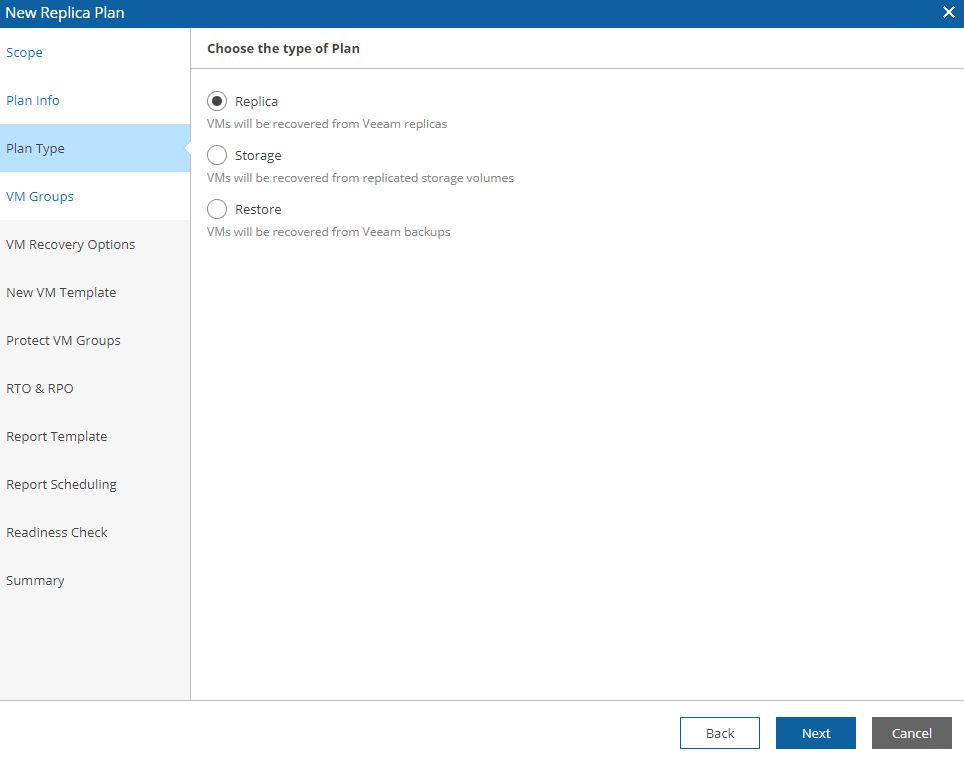
Picture 9 shows the detailed plan info and Picture 10 the plan type (next articles will deep how to set them up).
Picture 9
Picture 10
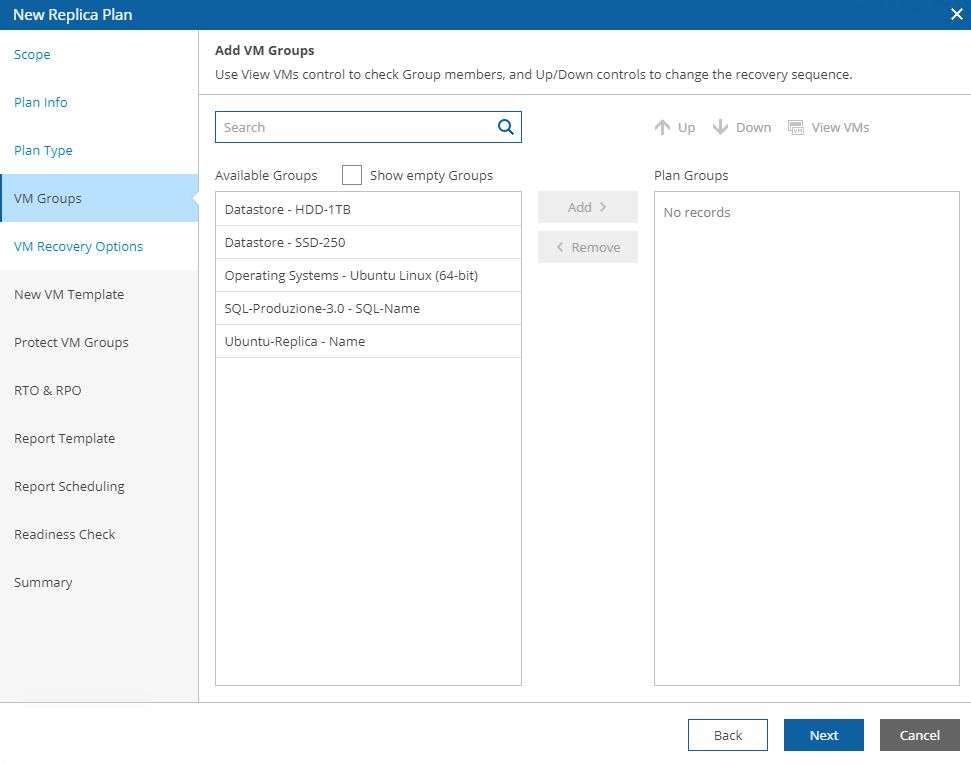
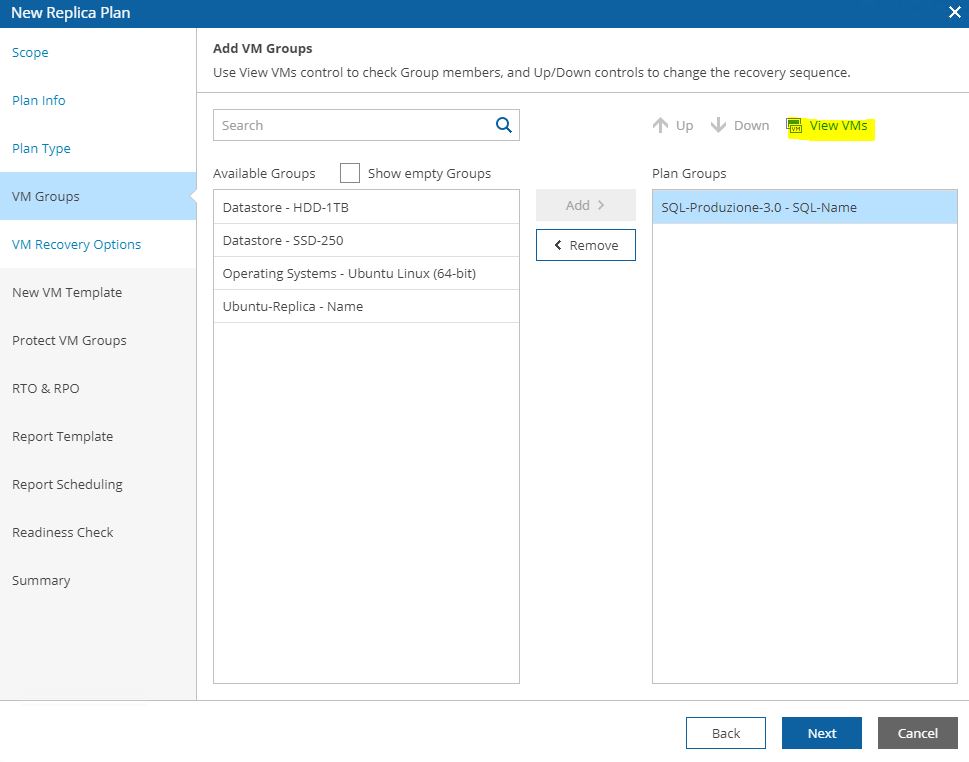
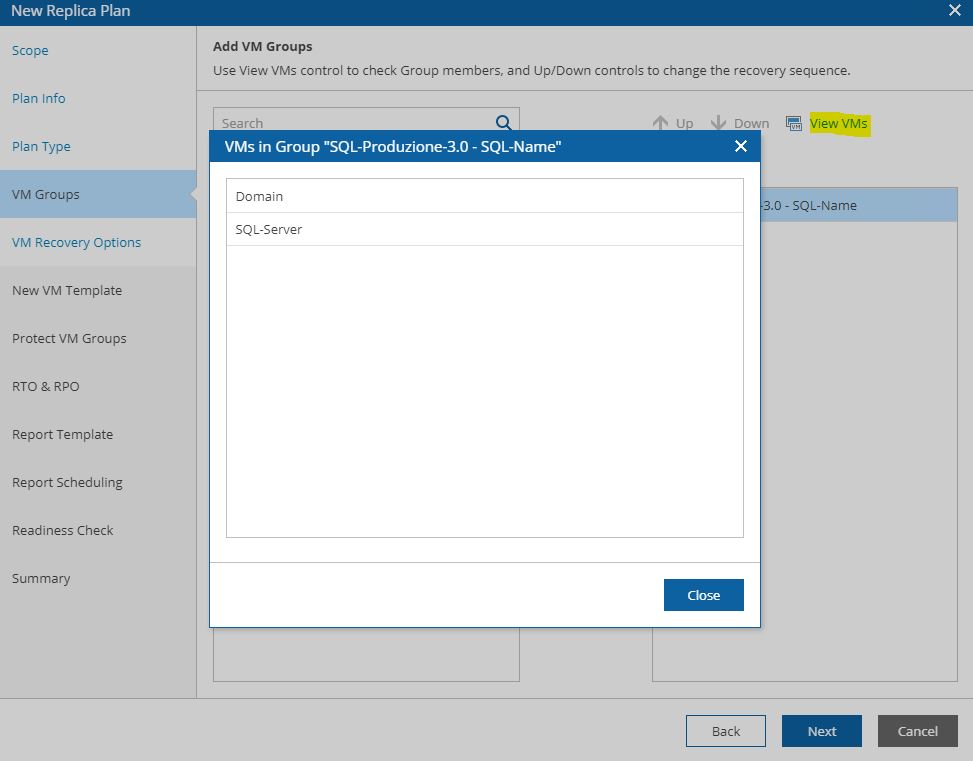
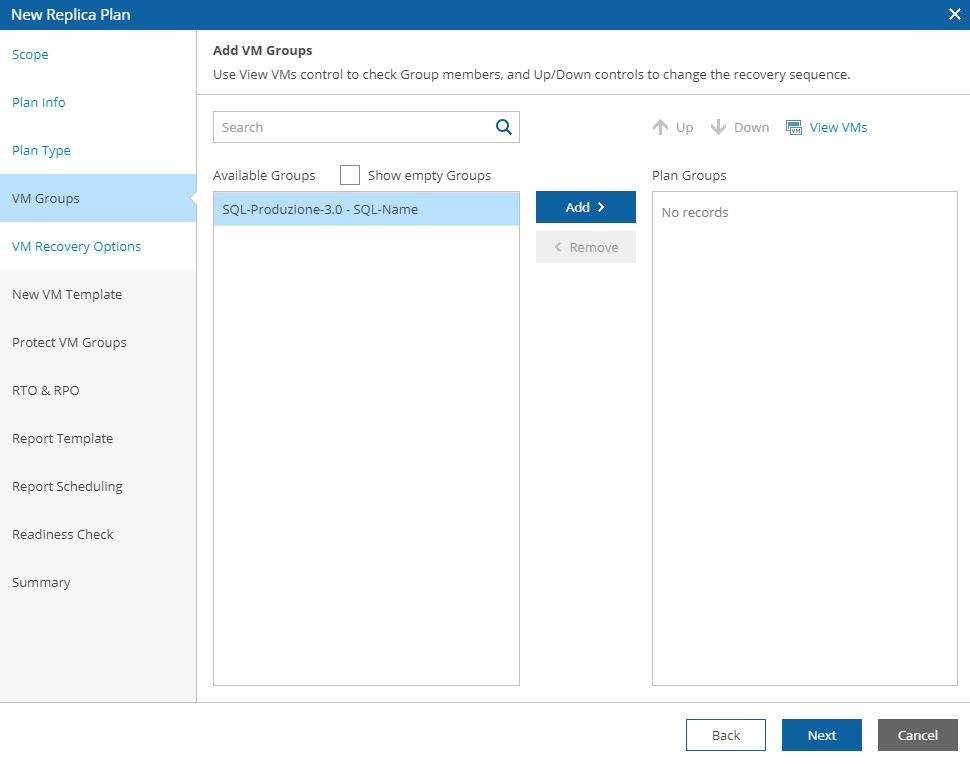
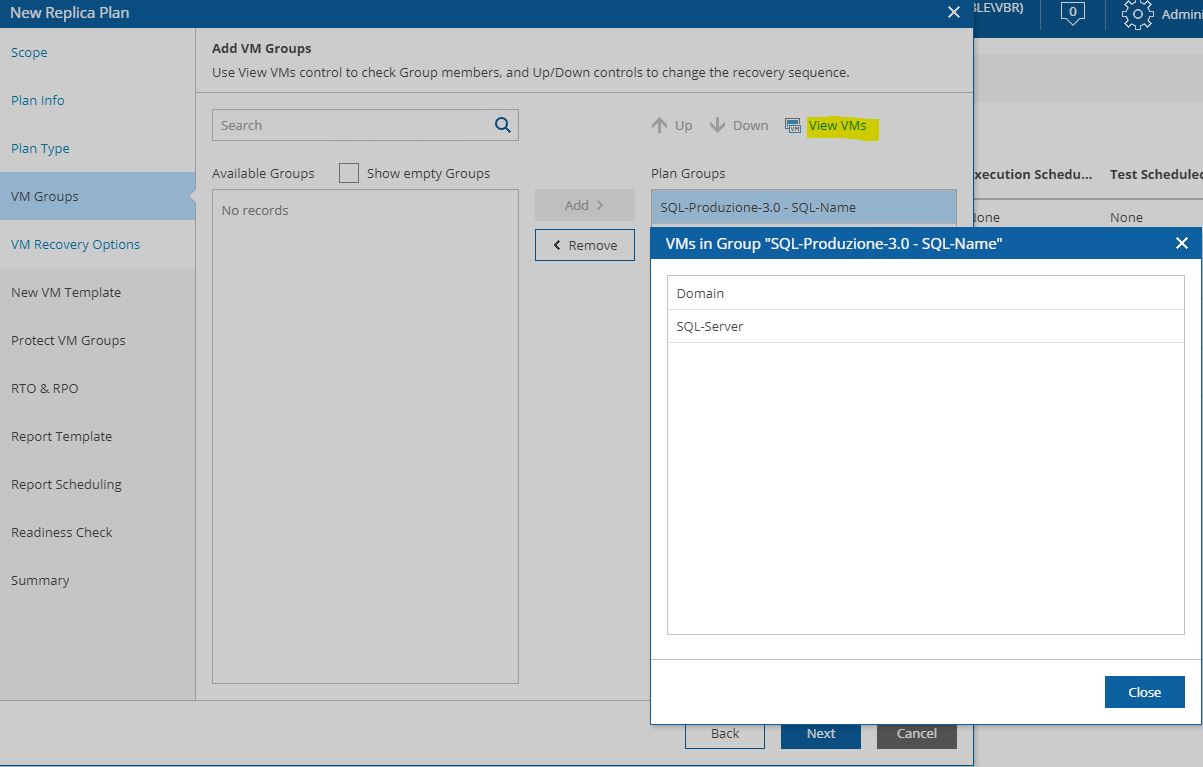
Pictures 11, 12, 13 show how it’s possibles to discover the VMs that belong to the groupselecting VM group.
Picture 11
Picture 12
Picture 13
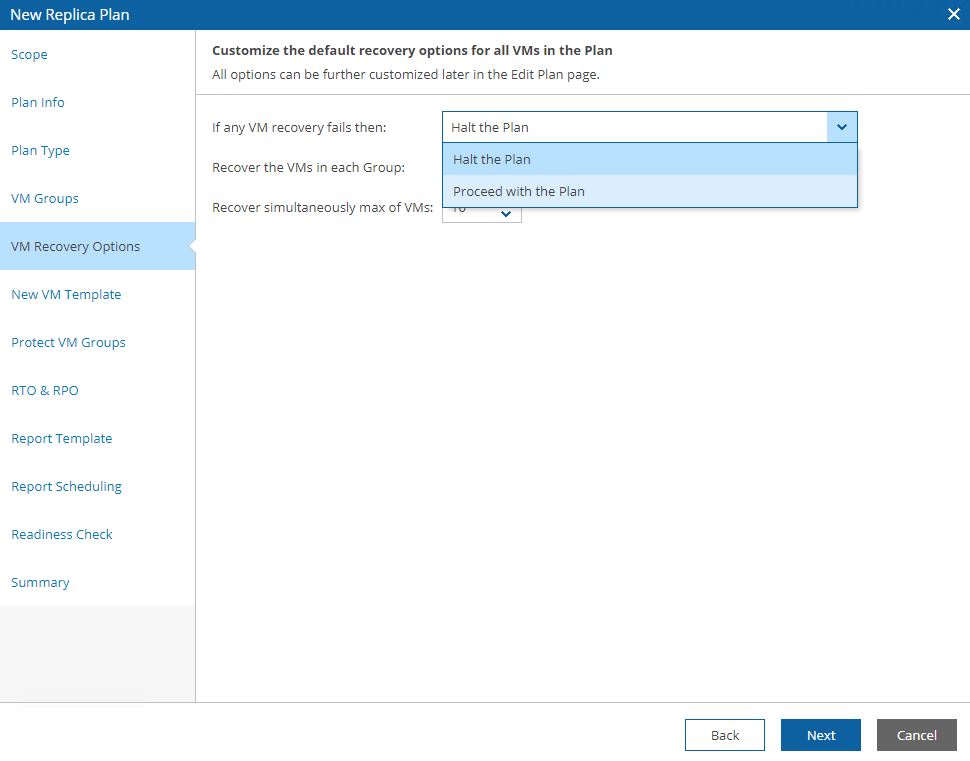
Picture 14 shows the control options for the DR plan. If something goes wrong the plan can be halted or not.
Picture 14
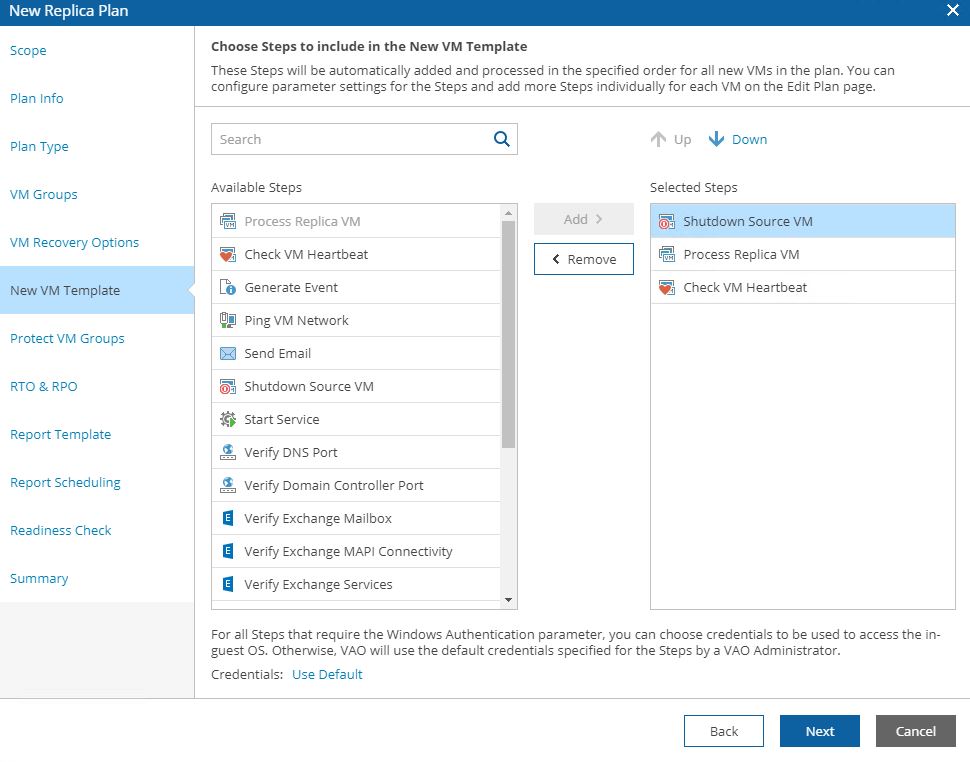
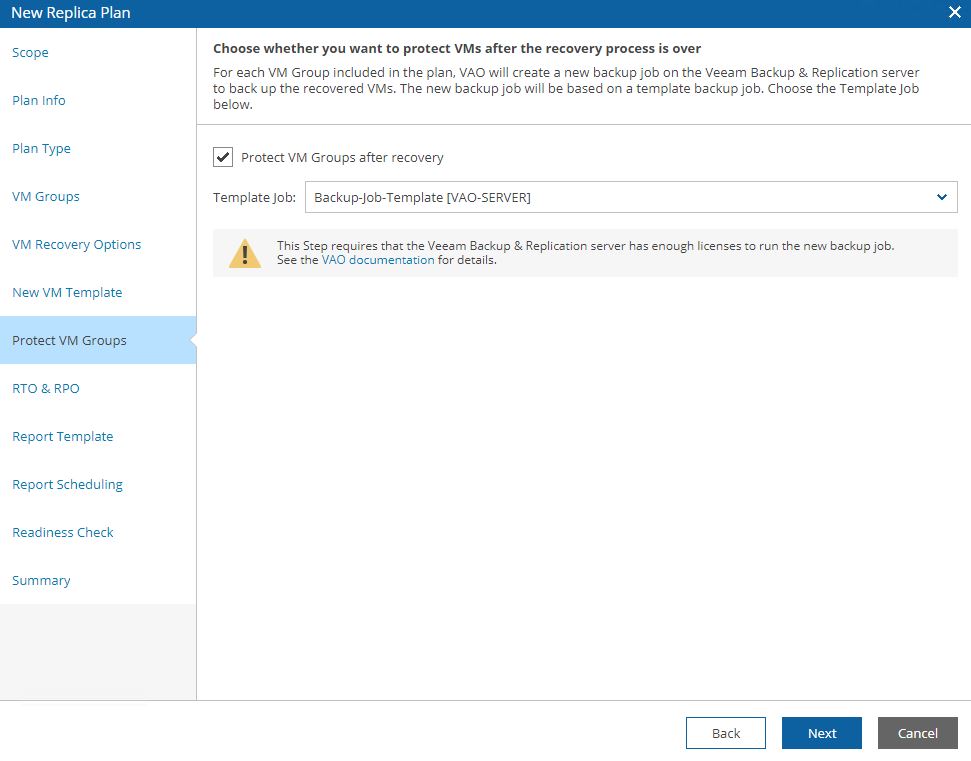
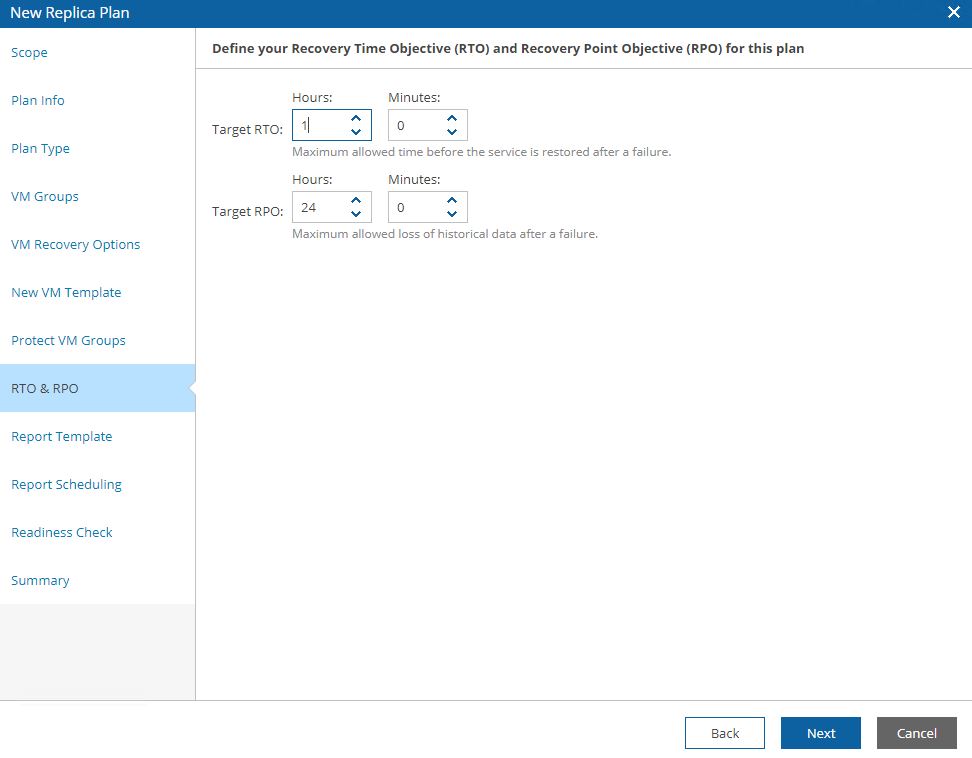
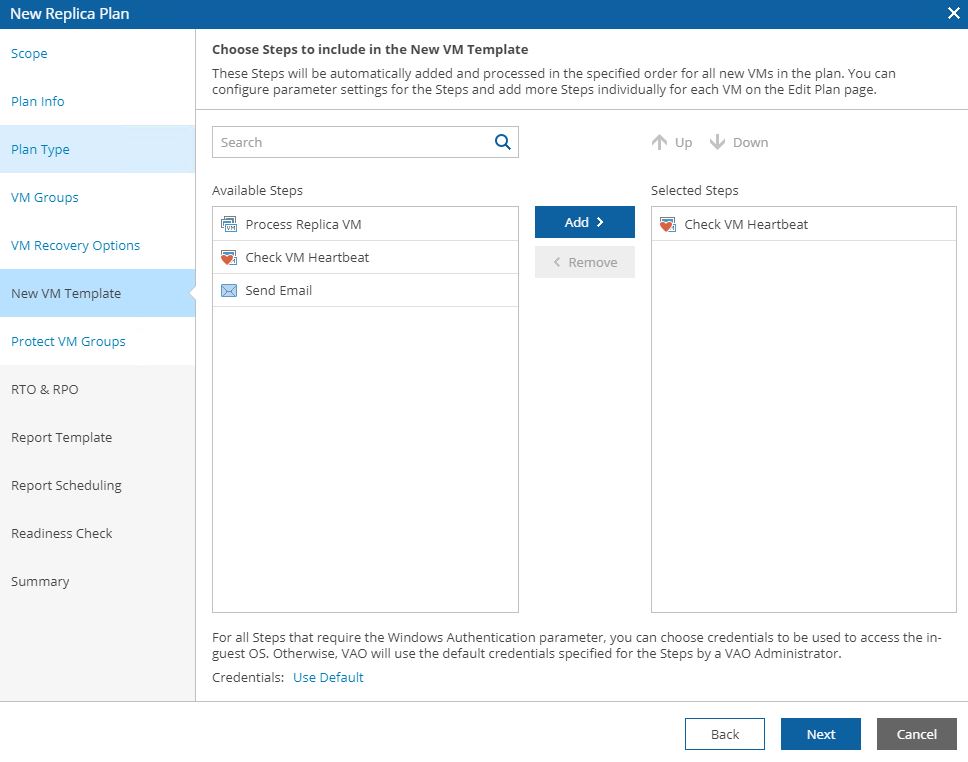
Picture 15 shows the steps, 16 the option to protect VMs switched on after the failover has been completed, 17 the RPO and RTO that the plan has to respect.
Picture 15
Picture 16
Picture 17
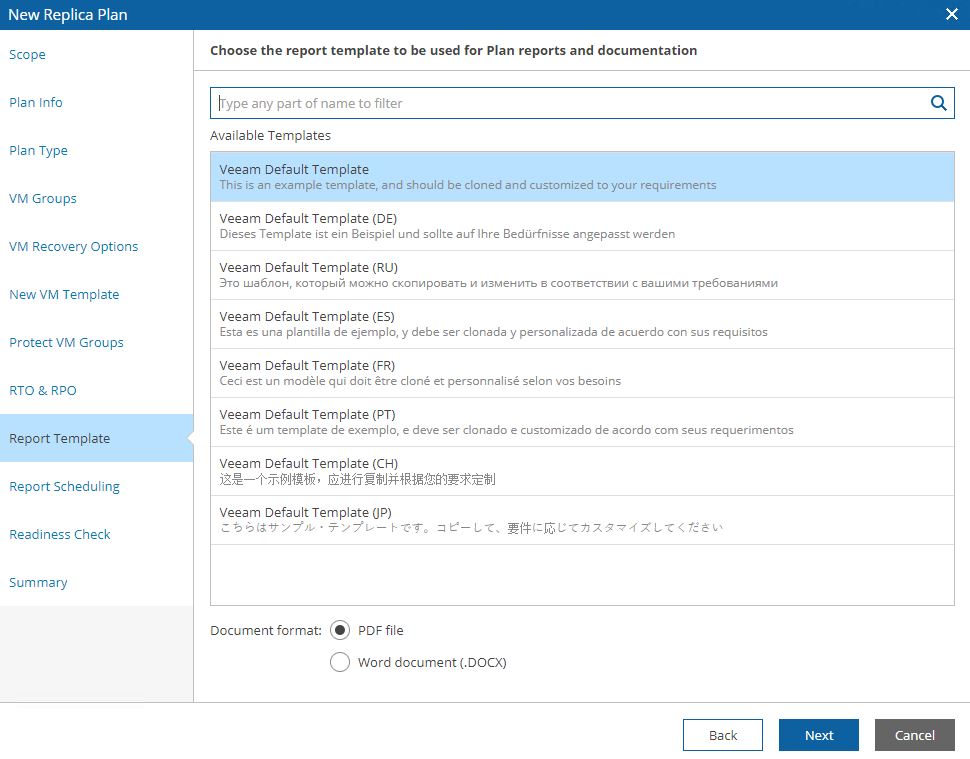
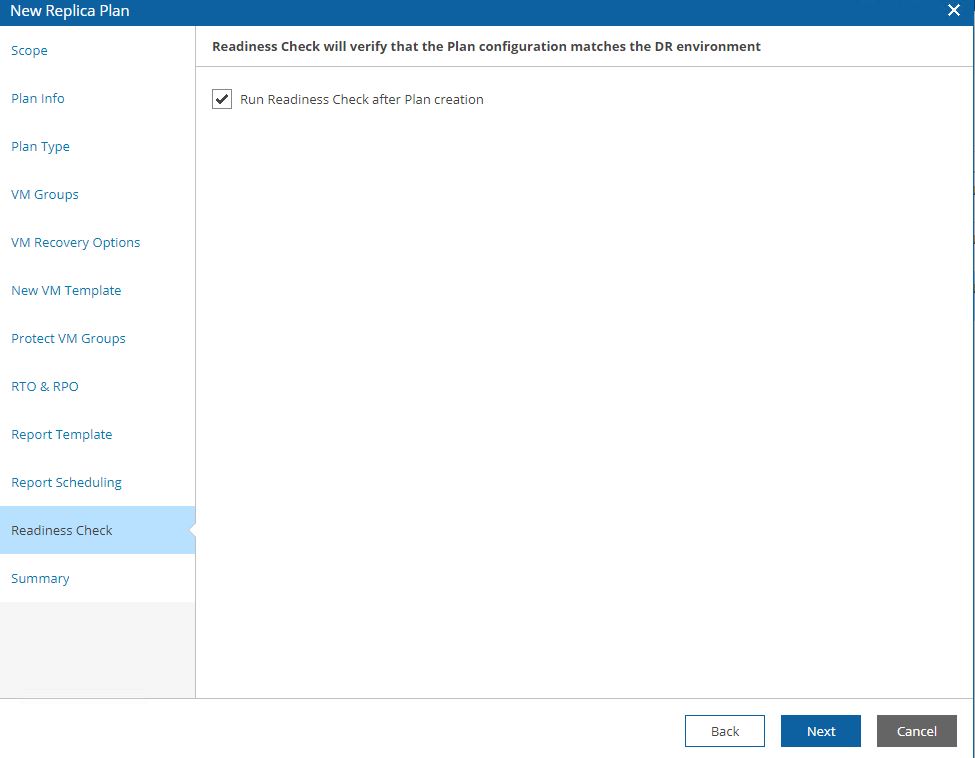
Picture 18 shows the template docs that will be used, while picture 19 shows a (for me)interesting mandatory check option.
Before doing any new activity the Readiness check analyzes that all components are correctly set up.
Picture 18
Picture 19
In my next article, I will cover two examples: DR-plan from Replica and DR-plan from backup. Keep in touch!
The first step by step guide how to set up a Disaster Recovery plan starting from a replica job.
Anyway, I suggest having a look at the previous articles before reading this one.
VDrO-Baseline 1 – VDrO-Baseline 2
In today’s example, I imagined implementing a DR-Orchestration for a company selling tickets. The two VMs that deliver the services are the Domain controller and SQL DB with installed the application needed.
The main points are:
Setting up replica job using VBR present into VDrO
Creating Tags
Adding the plan components to the scope
Creating a lab group
Configuring the Orchestration Plan
Testing
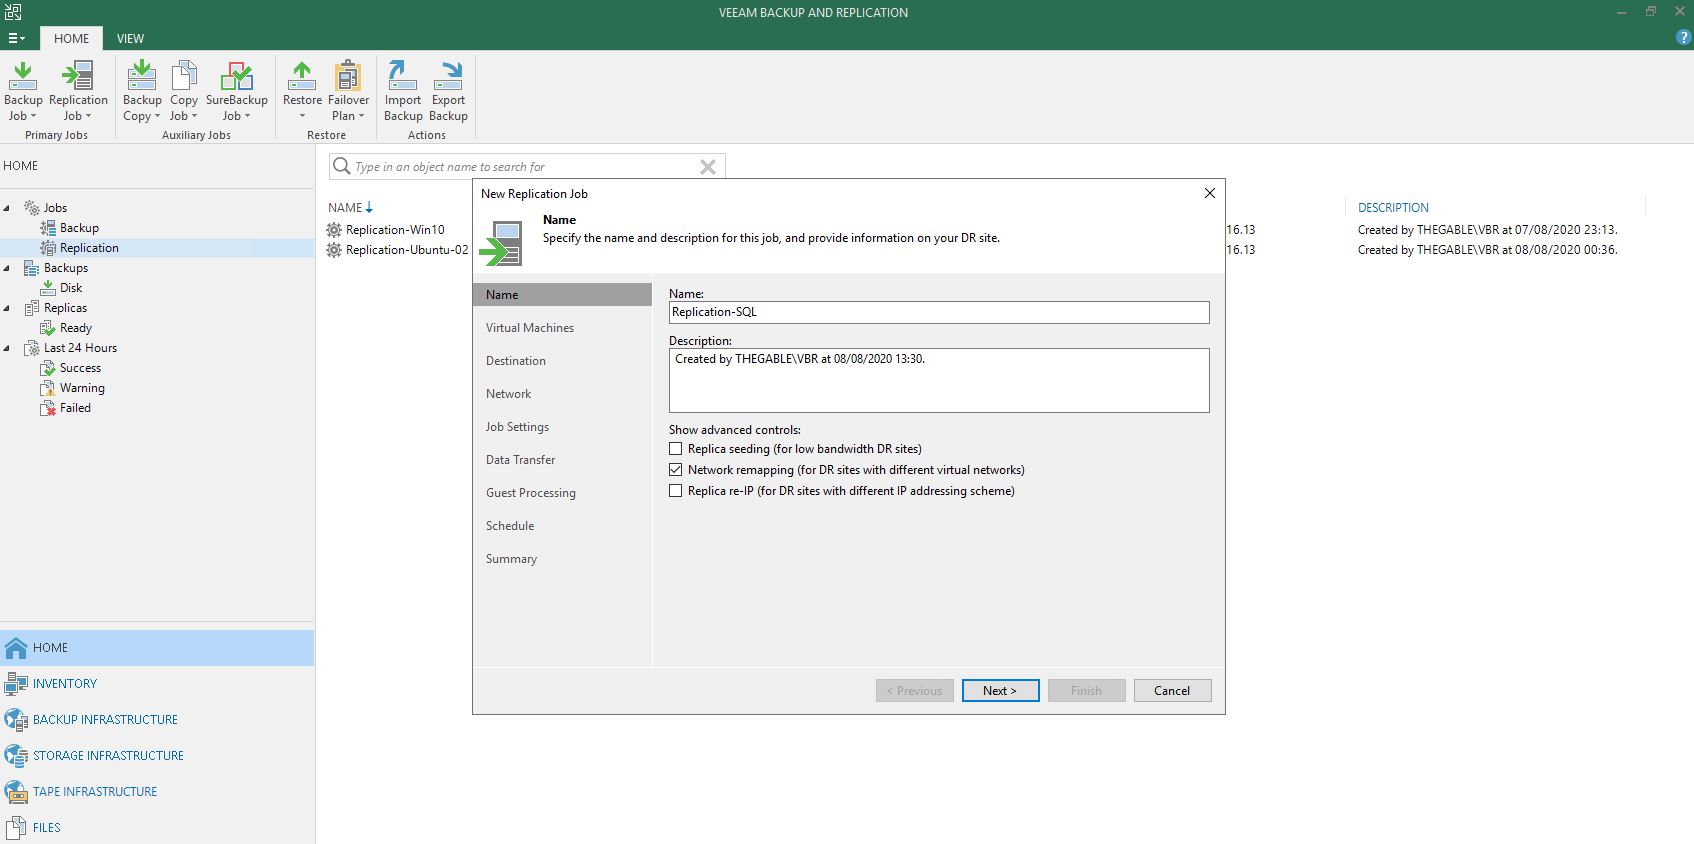
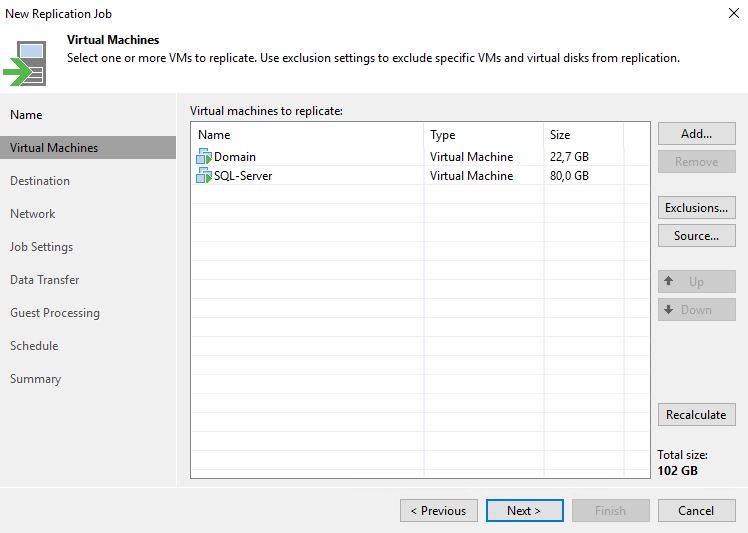
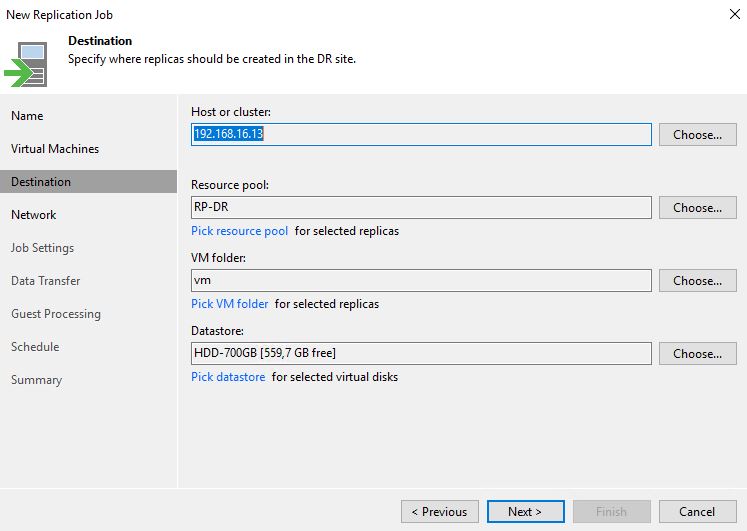
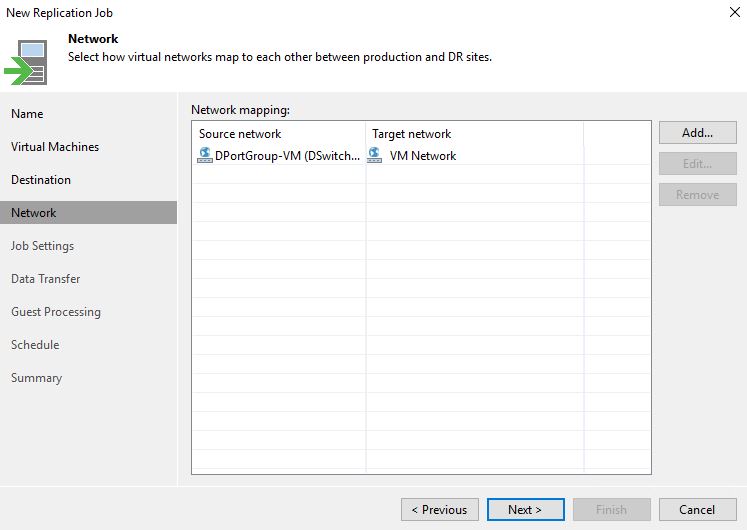
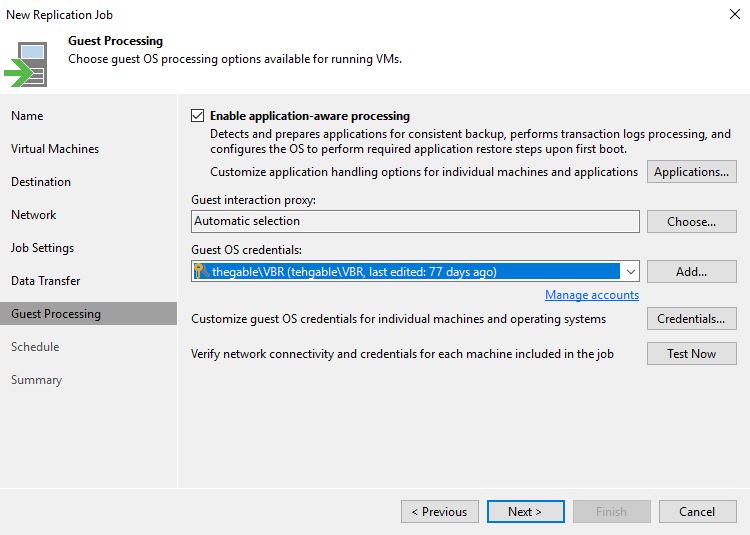
1. Setting up Replica Job
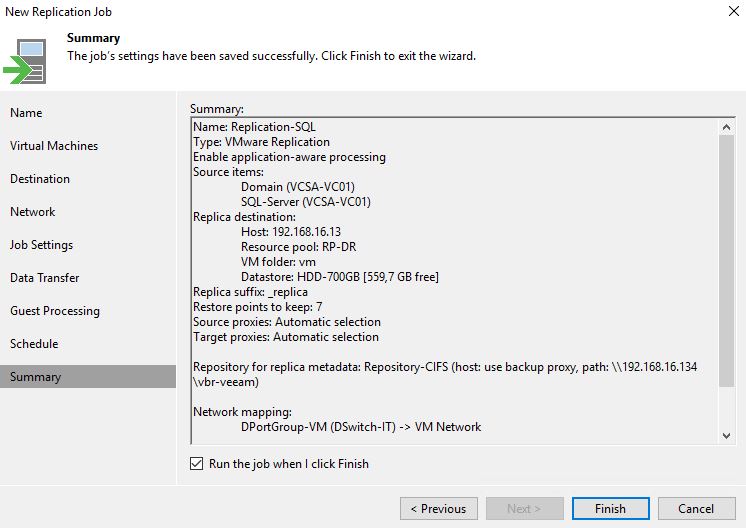
From the Veeam console, it’s quite easy to set up the Replica Job (From Picture 1 to 5).
Picture 1
Picture 2
Picture 3
Picture 4
Picture 5
Picture 6
2.Creating Tags
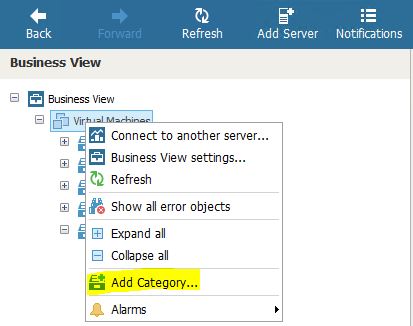
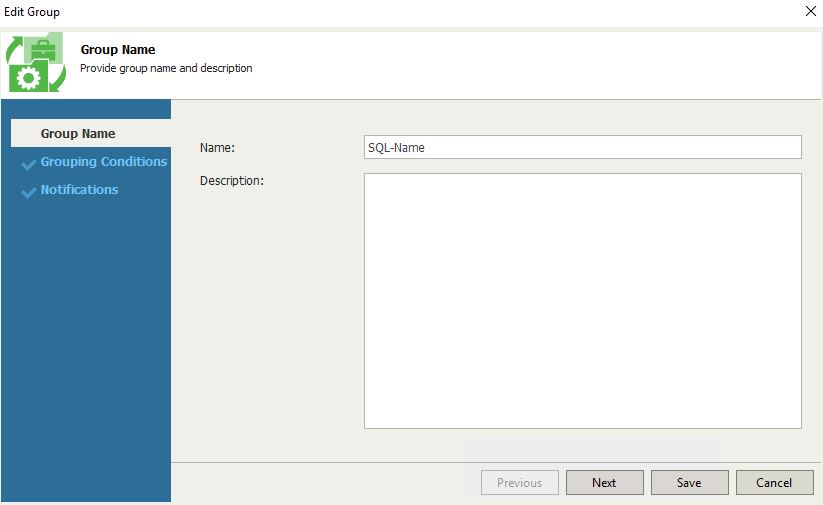
Veeam-One Business View is reachable from the Veeam Monitor console. To create the tagging just select add Category (Picture 7) from the resource you want to tag (in the picture are Virtual machines).
Picture 7
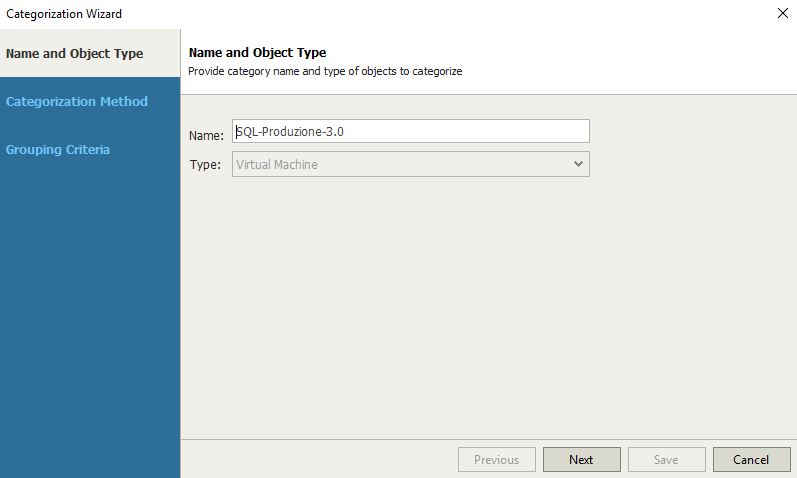
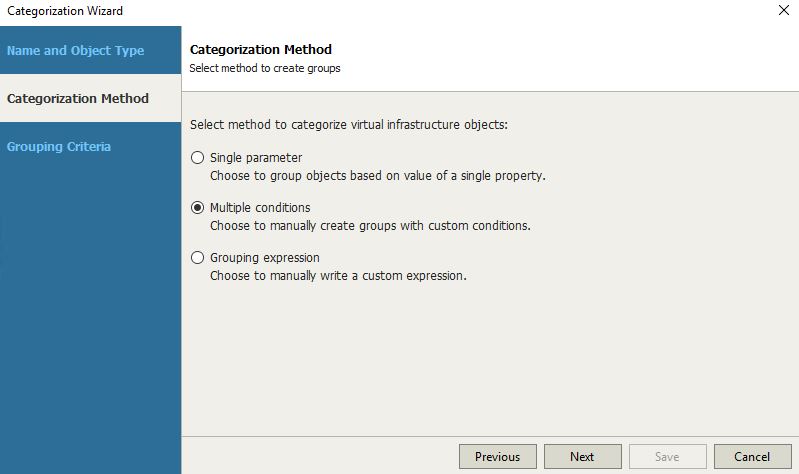
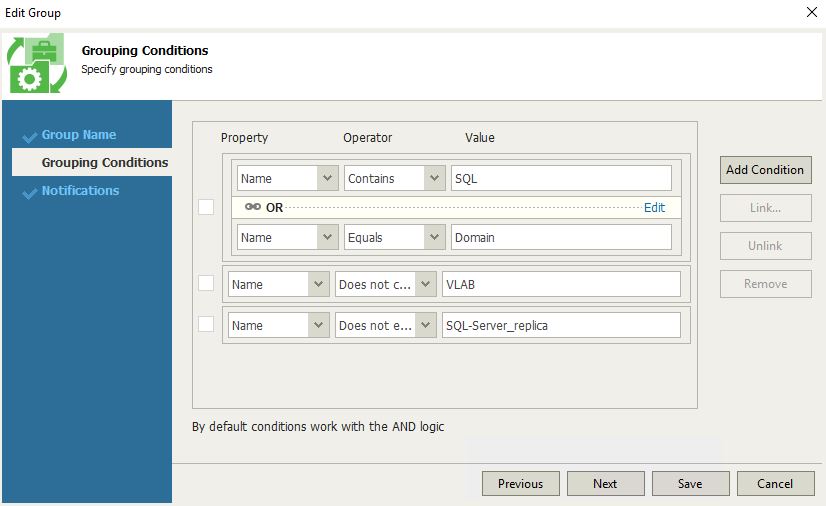
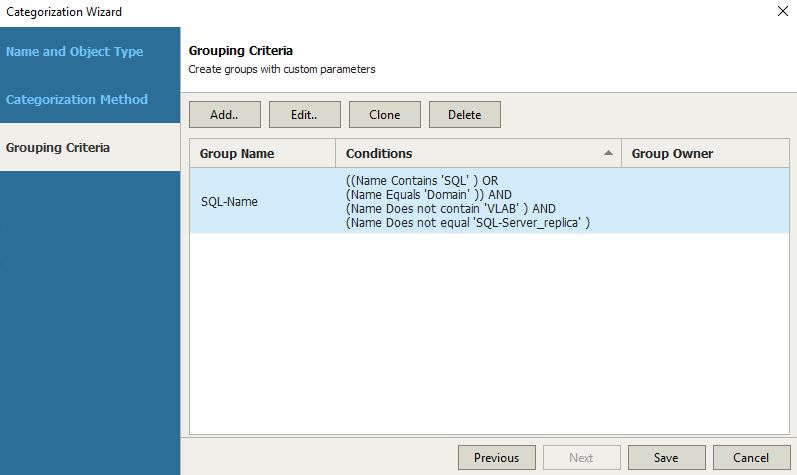
After folding it up with a name (Picture 8) in pictures 9, 10, 11, and 12 is shown how easy it is customizing the tag.
Picture 8
Picture 9
Picture 10
Picture 11
Picture 12
Picture 11 shows how to concatenate the conditions.
That means that it is possible to add different conditions selecting for every entry the logical operator “and – or”.
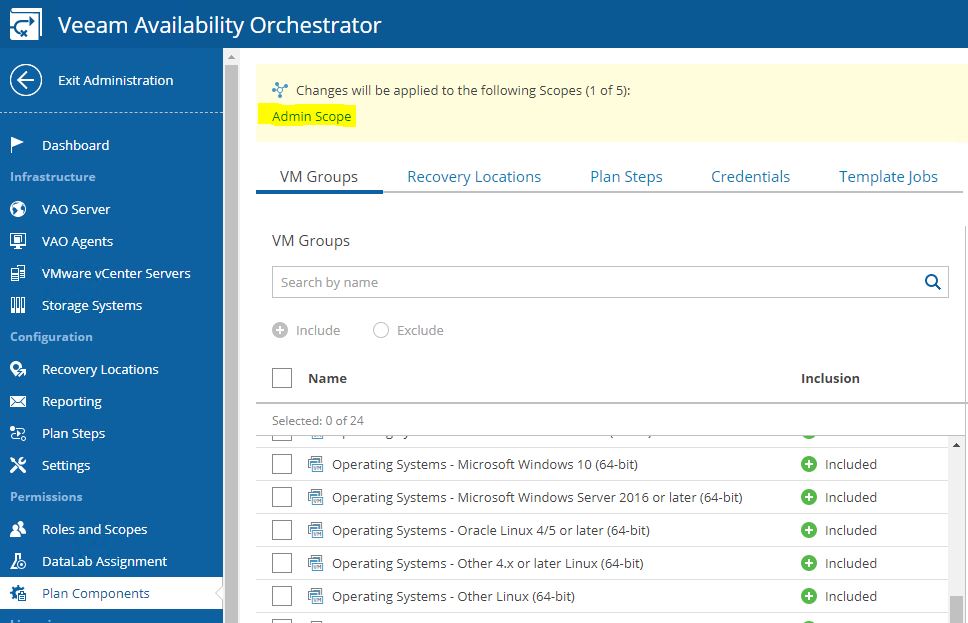
3. Adding the plan components to the scope
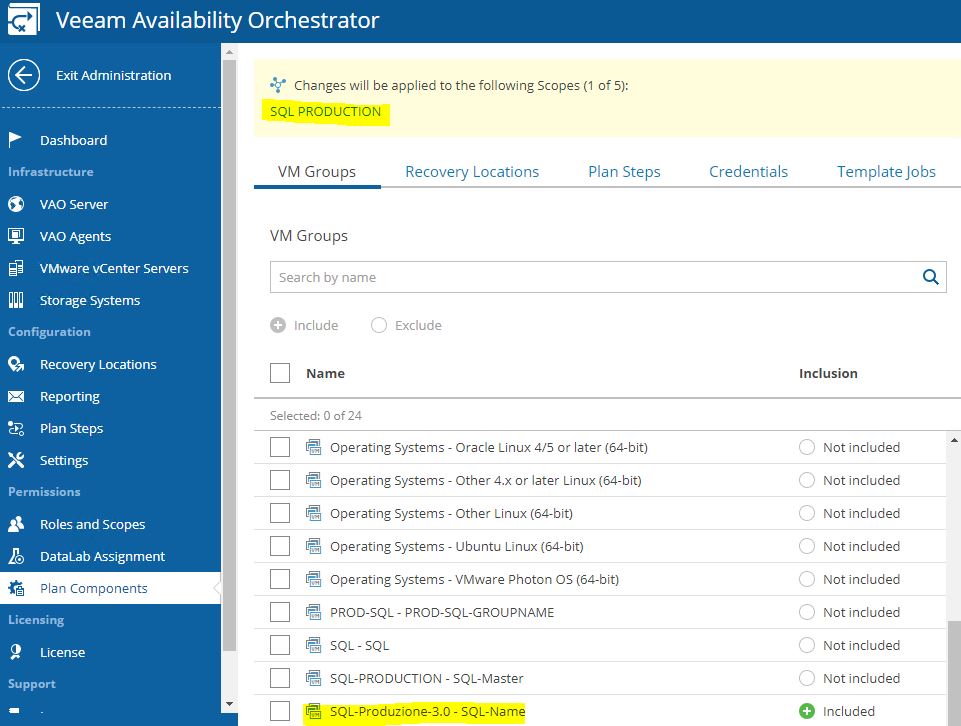
From the Administrator panel, through plan components, it is possible to select which VM groups can be added to the scope.
In our example, we are going to create a DR-strategy for SQL-Production scope (picture 14) using the VM Groups named SQL – Produzione (Picture 15). How to do it? Just clicking on the include button.
Picture 13
Picture 14
Picture 15
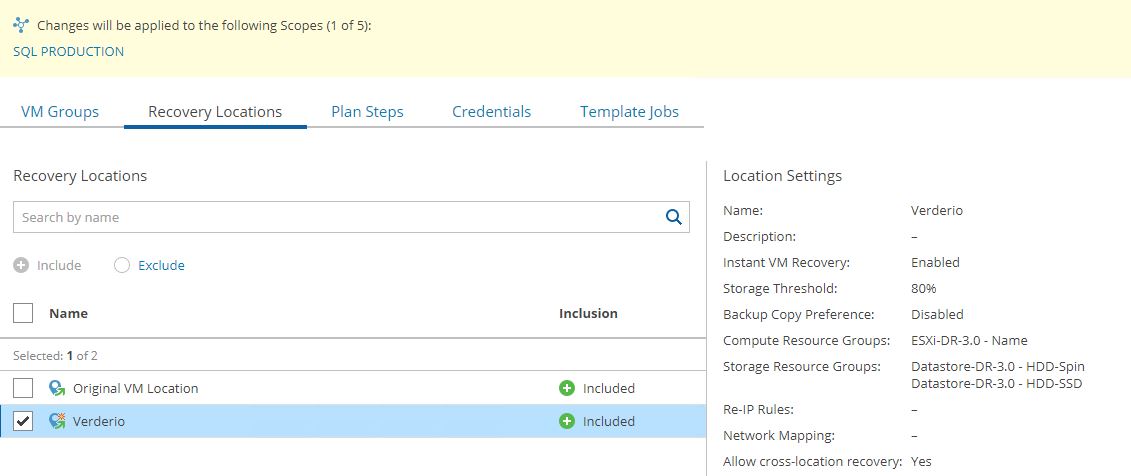
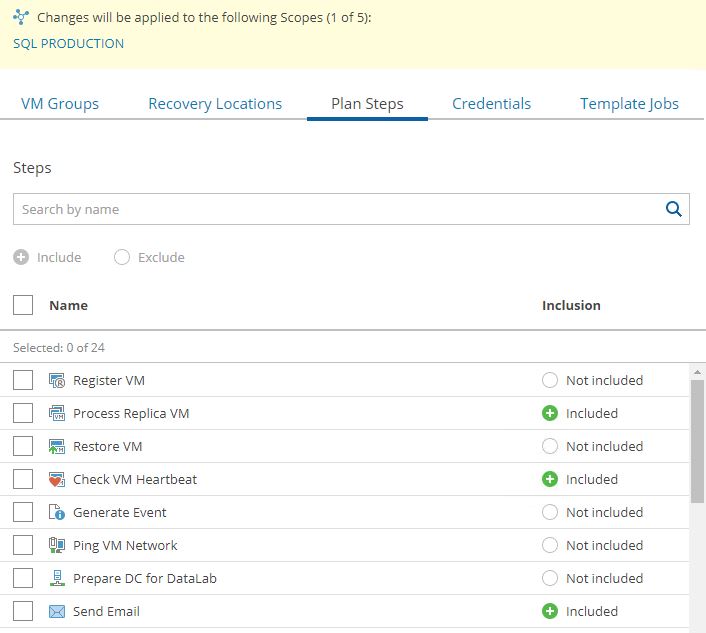
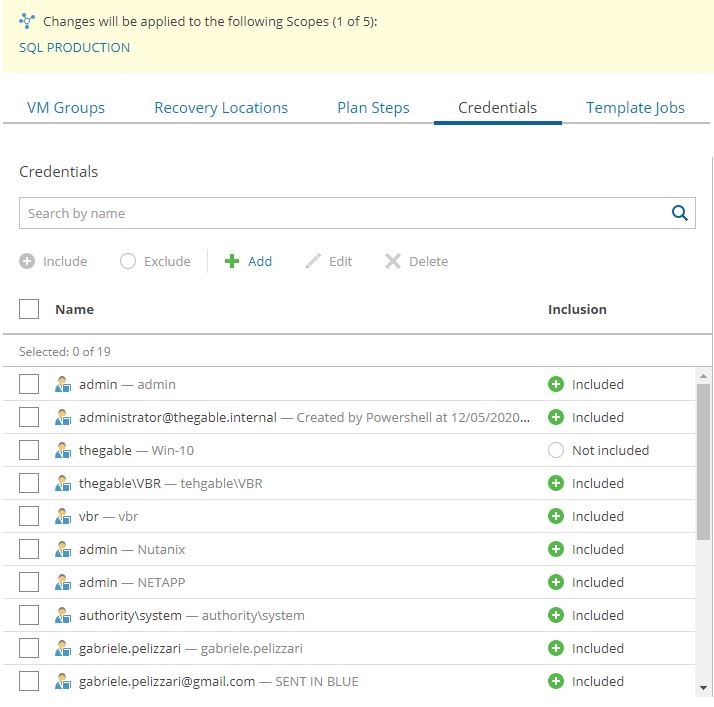
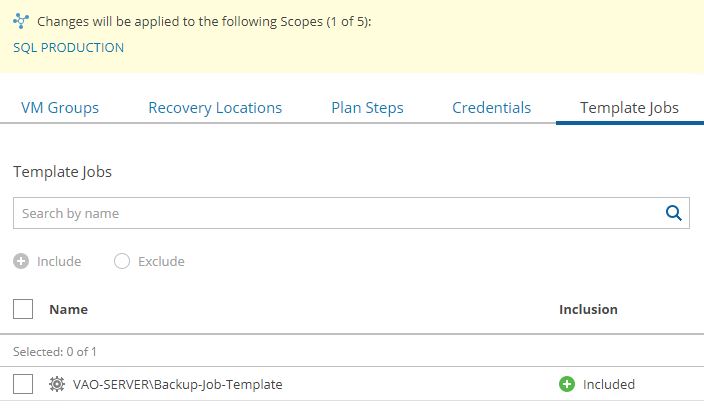
Now it’s time to repeat the same procedure for Recovery location (Picture 16), Plan steps (Picture 17), Credential (Picture 18), and Template jobs (Picture 19).
Picture 16
Picture 17
Picture 18
Picture 19
Now that we have finally added all componentsto the baskets. weneed to create an Orchestration Plan for this specific service.
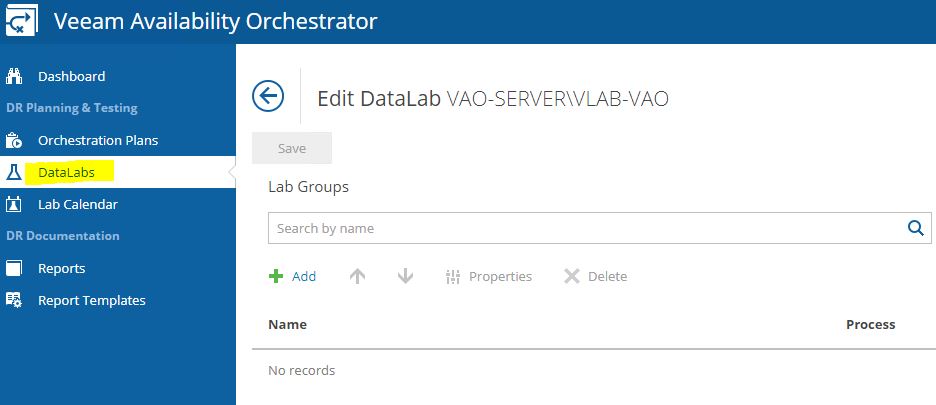
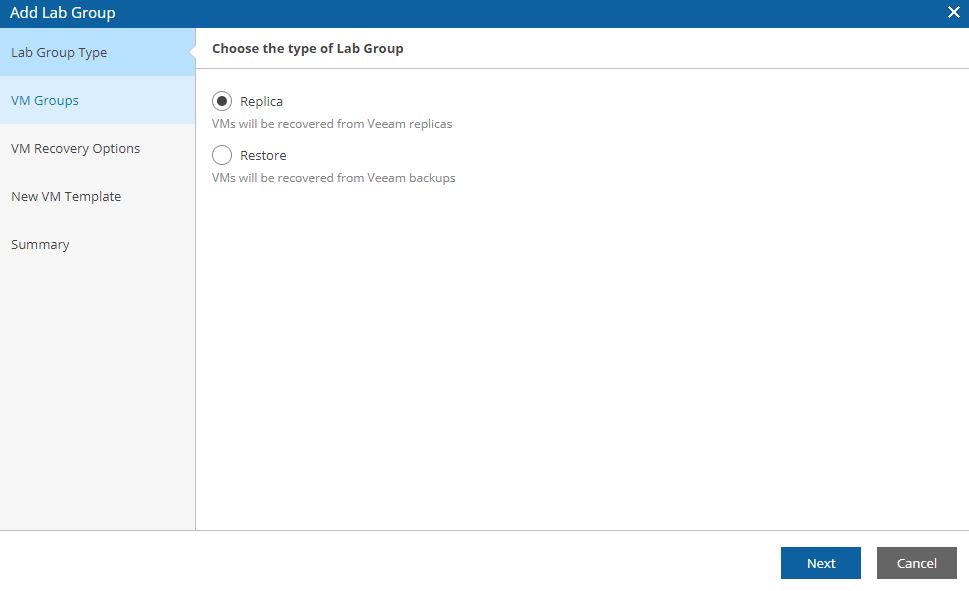
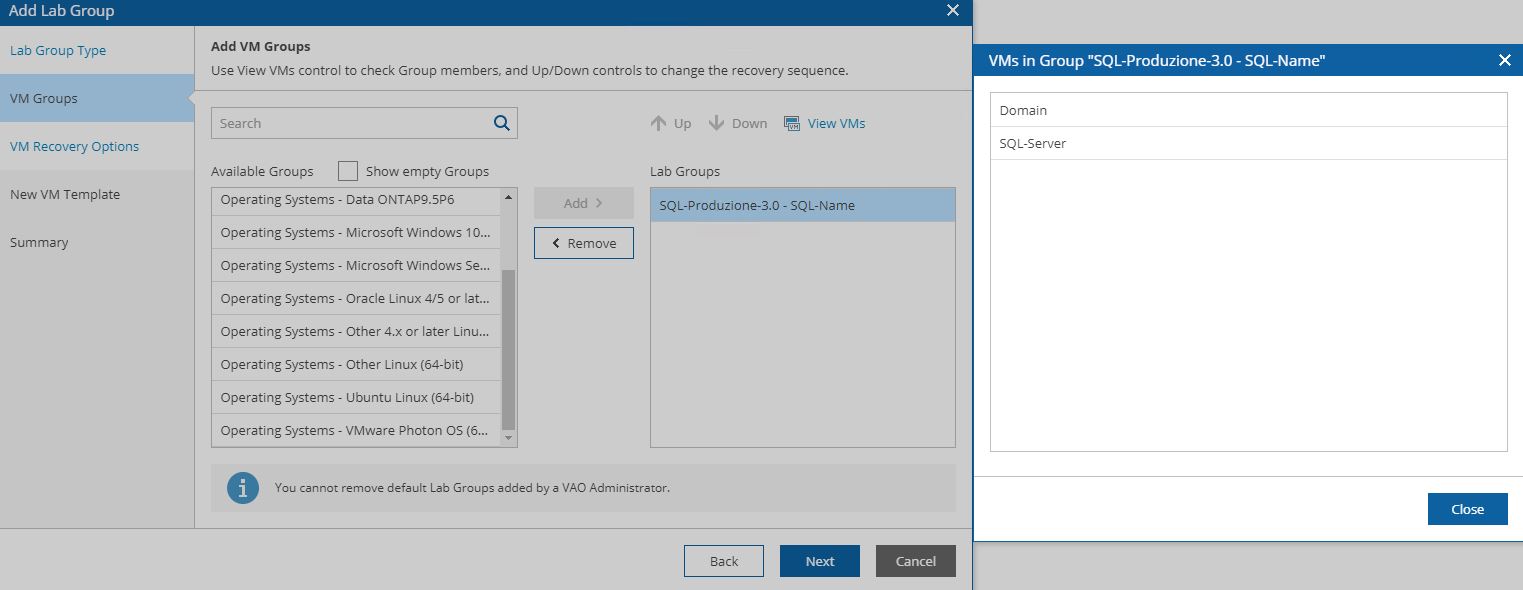
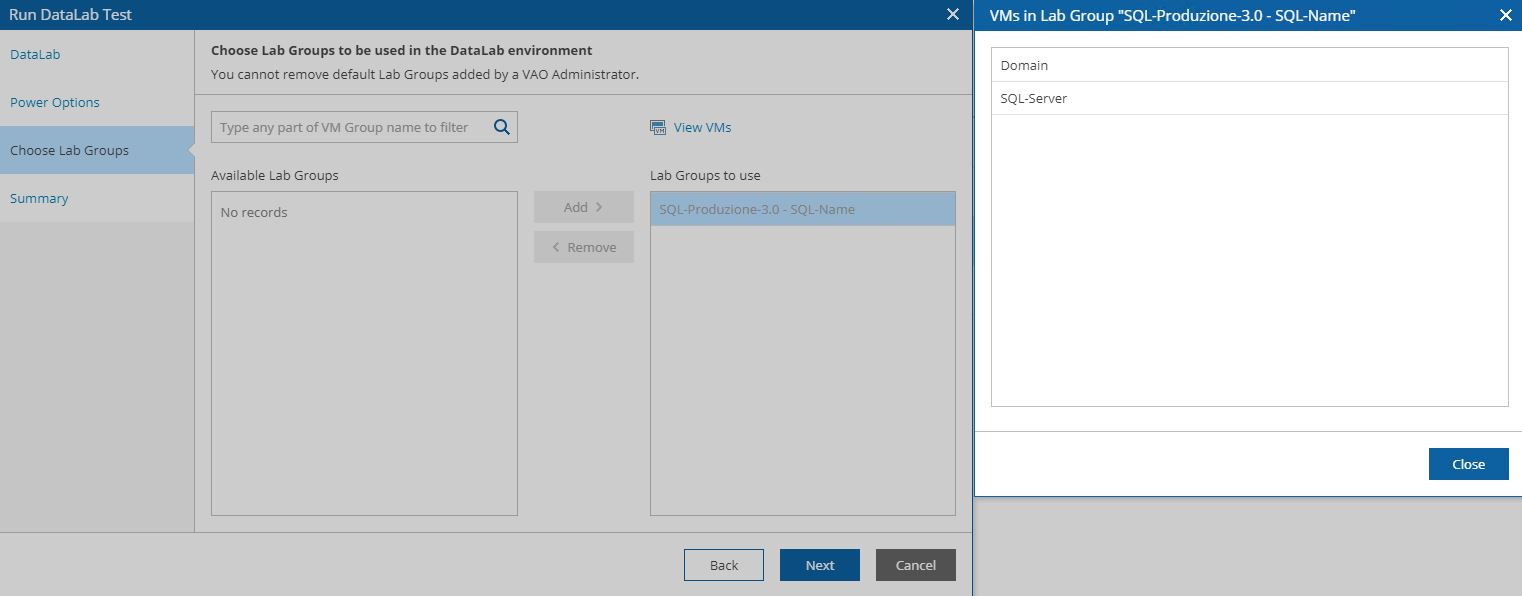
4. Creating a Lab group
From the main menu select Datalabs entry.
Now clicking on the add button, it’s possible to assign the tasks that will be performed during tests to the Datalab as shown in Picture 20,21,22.
Remember that the Datalab assignment has been already performed from the VDrO administrator page.
Picture 20
Picture 21
Picture 22
5. Configuring the Orchestration Plan
The configuration wizard has been already explained in my previous article (VDrO – Baseline2).
Please find hereafter a short summary.
If you set it up correctly you should see your VMs in the VMGroups (picture 27&28) as they belong to the scope set on step 2 (Picture 24).
Picture 23
Picture 24
Picture 25
Picture 26
Picture 27
Picture 28
Picture 29
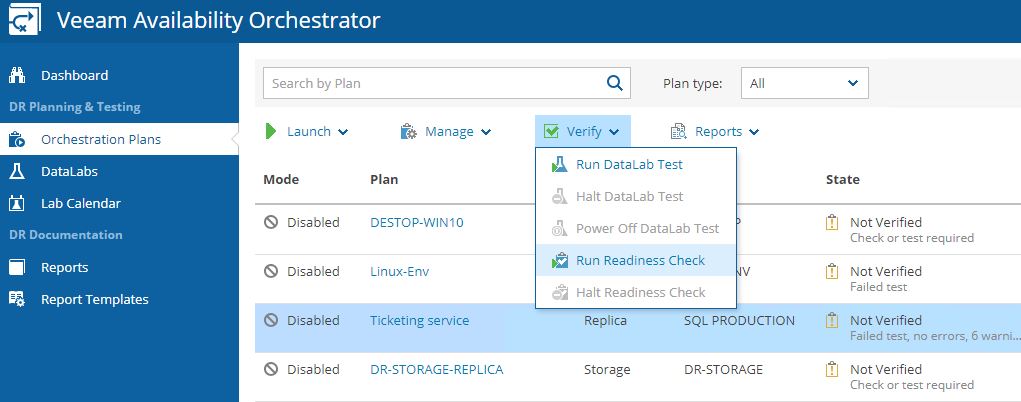
6. Testing
There are two different tests performed by VDrO.
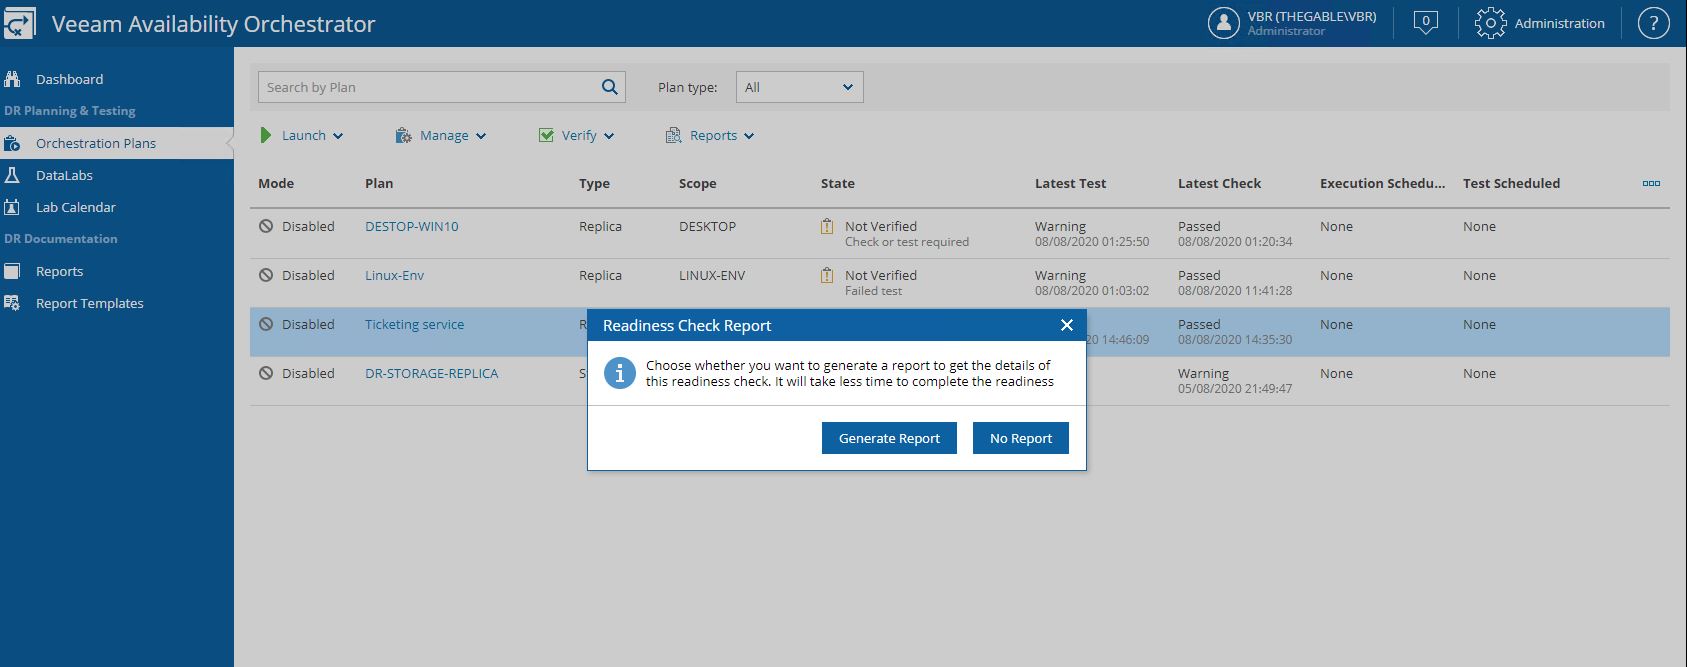
Readiness Check (Picture 30-31) is a low-impact method to confirm that the configuration of an orchestration plan matches the DR environment.
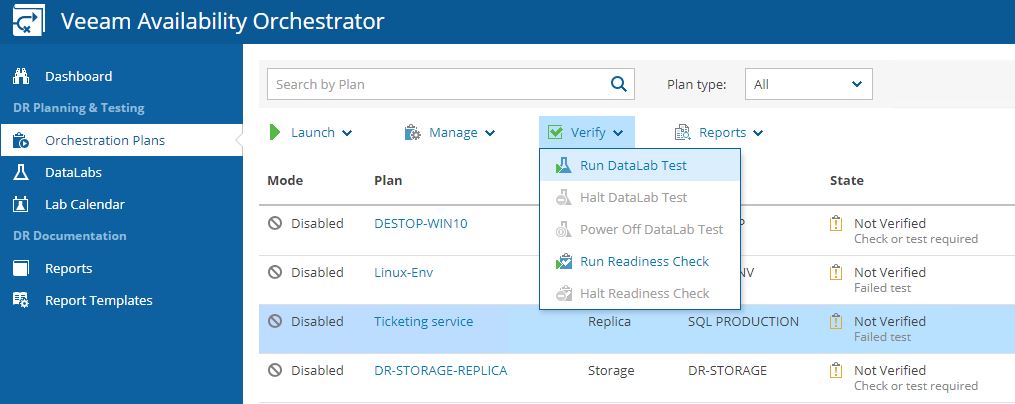
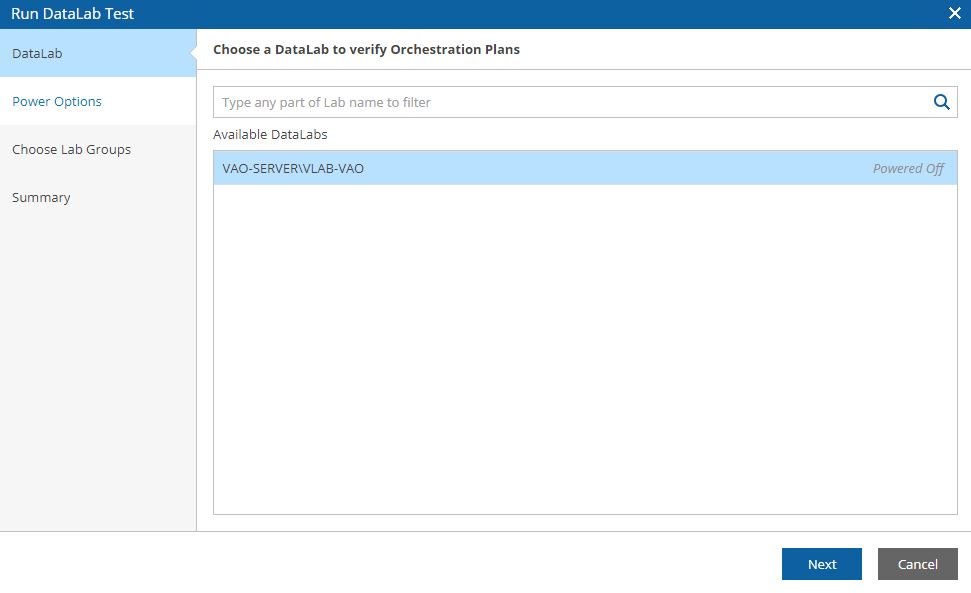
Datalab Test simulates the DR starting VMs, Applications, and Services into a different network. The data labs have to be set up from the VBR console (Picture 32-34).
Picture 30
Picture 31
Picture 32
Picture 33
Picture 34
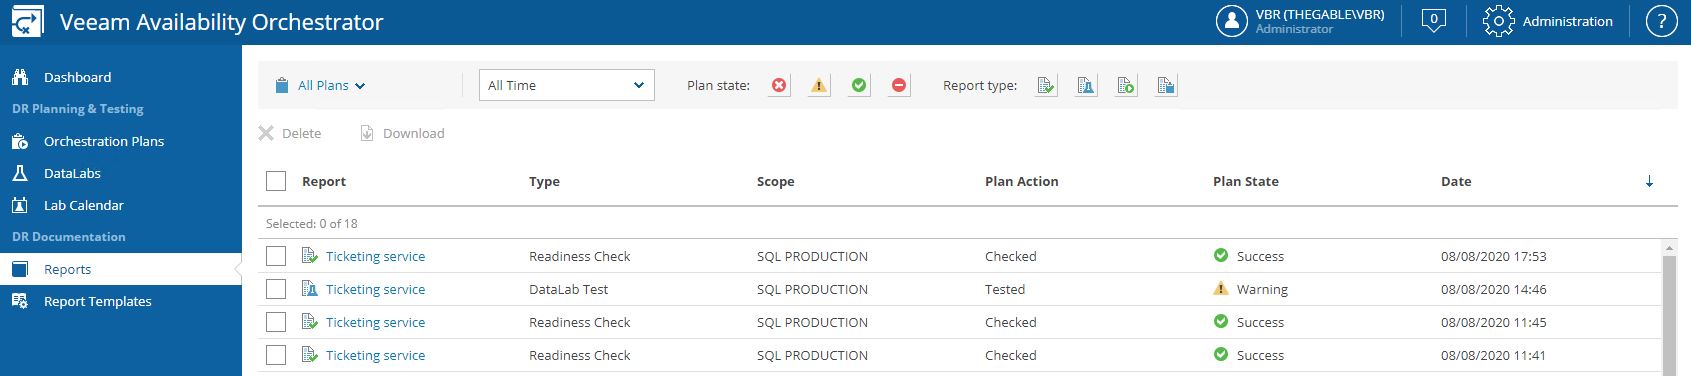
All reports are available from the Reports menu (Picture 35).


 Picture 1
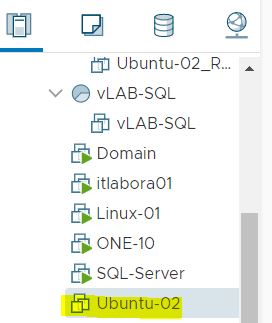
 Picture 3
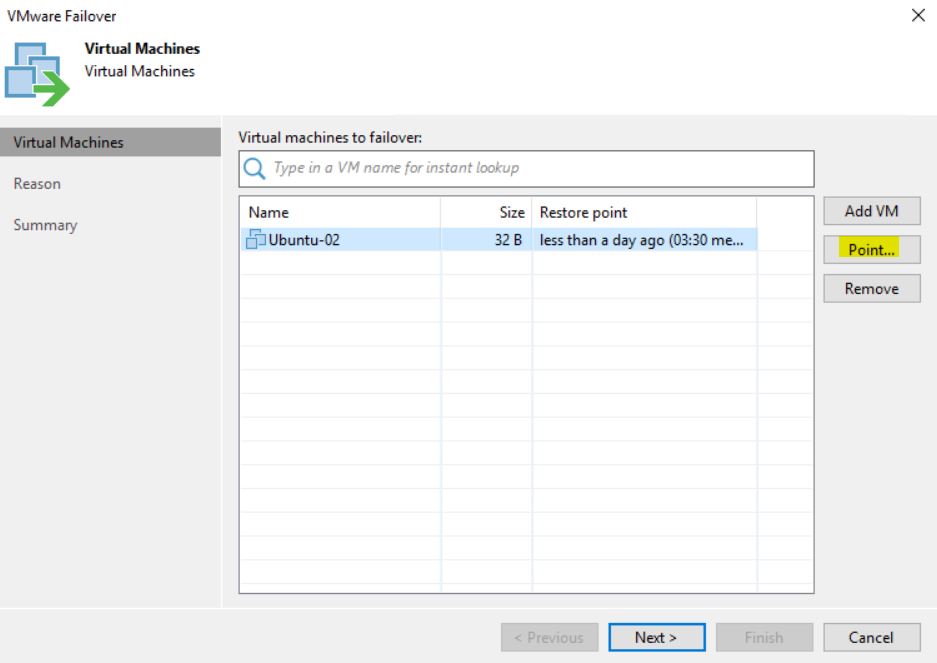 Picture 4
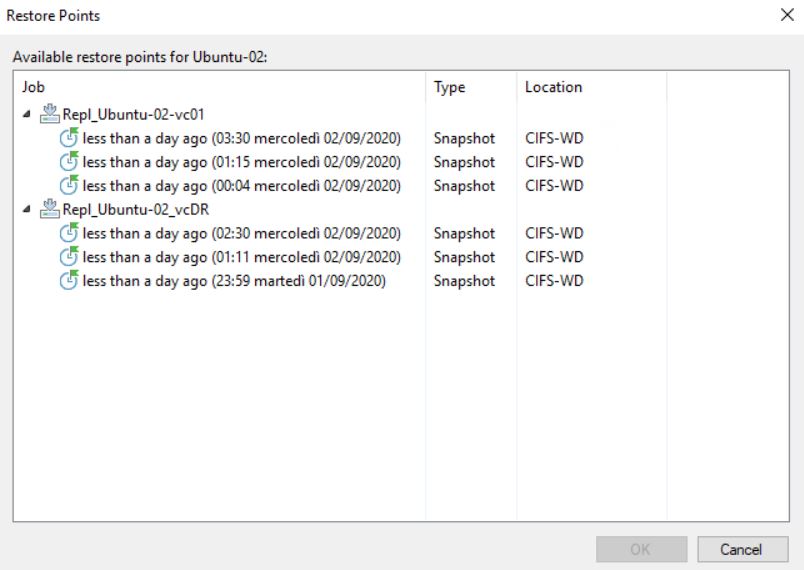 Picture 5
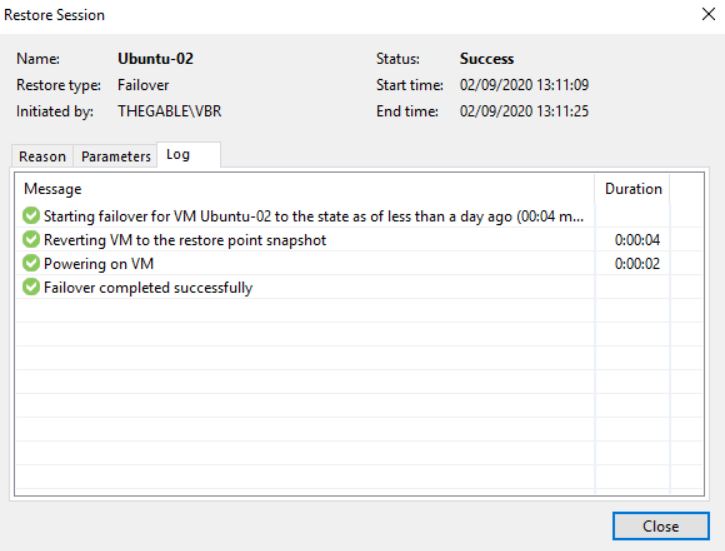 Picture 6
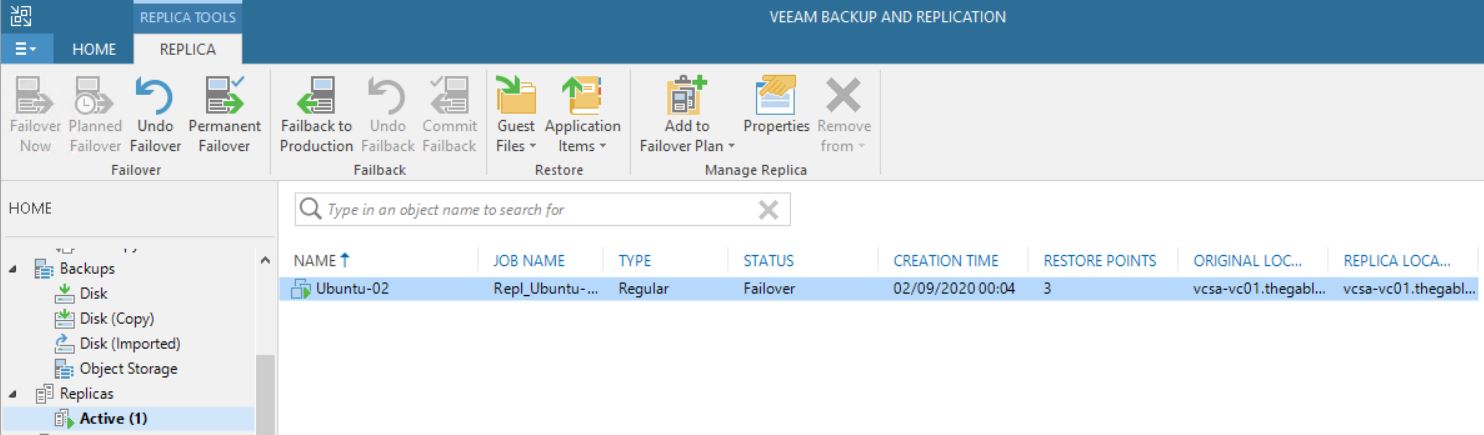 Picture 7
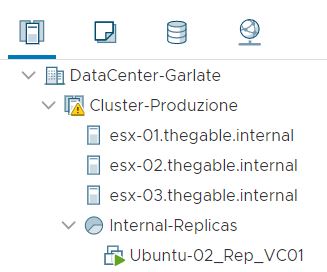 Picture 8
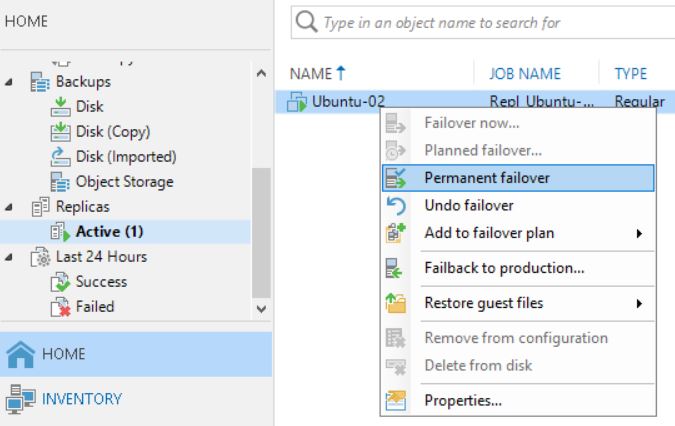 Picture 9
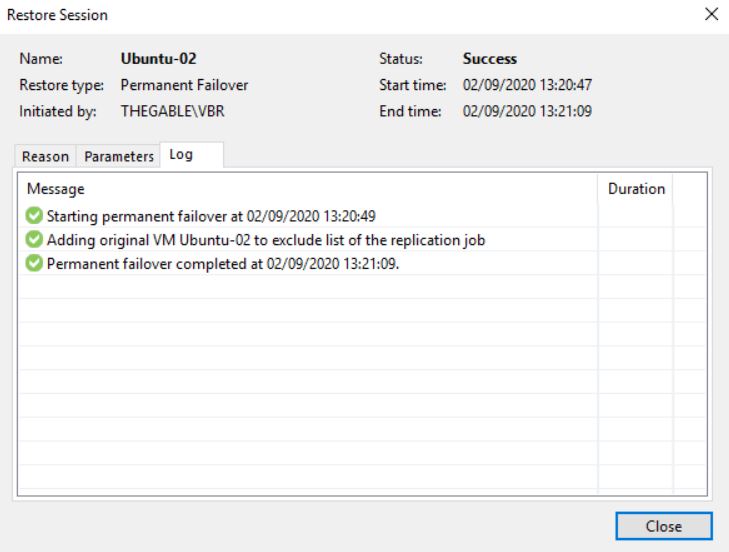 Picture 10
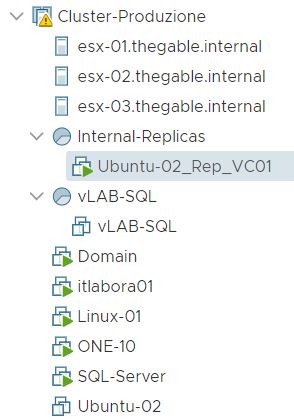 Picture 11
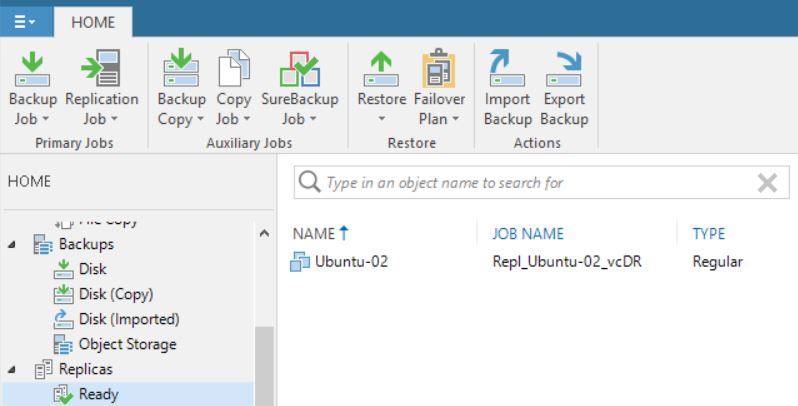 Picture 12
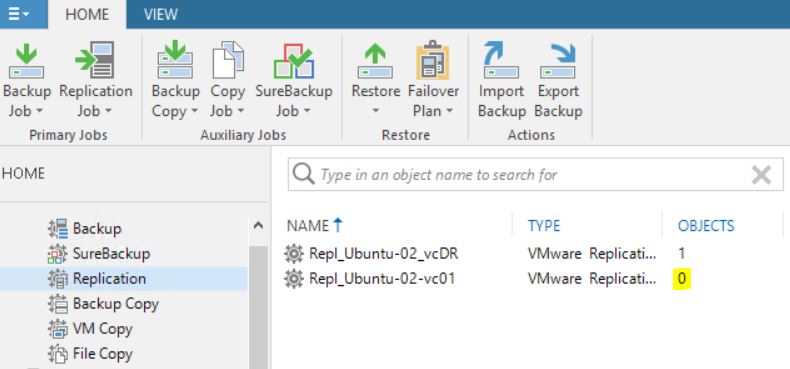 Picture 13
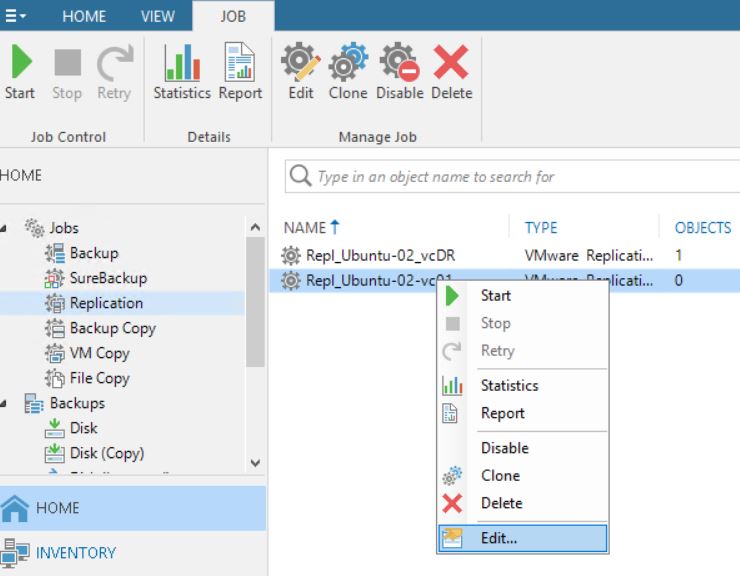 Picture 14
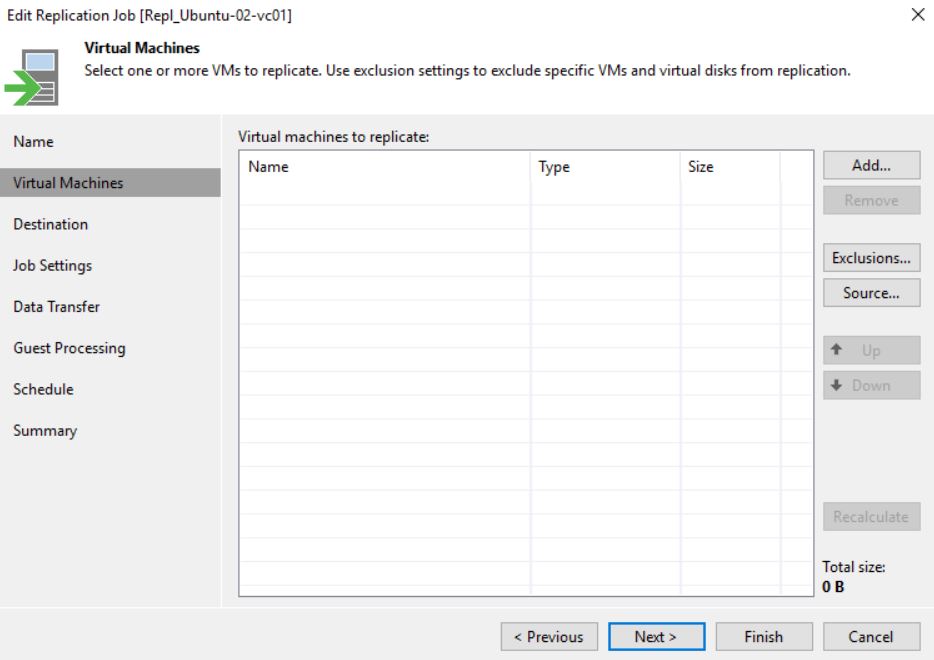 Picture 15
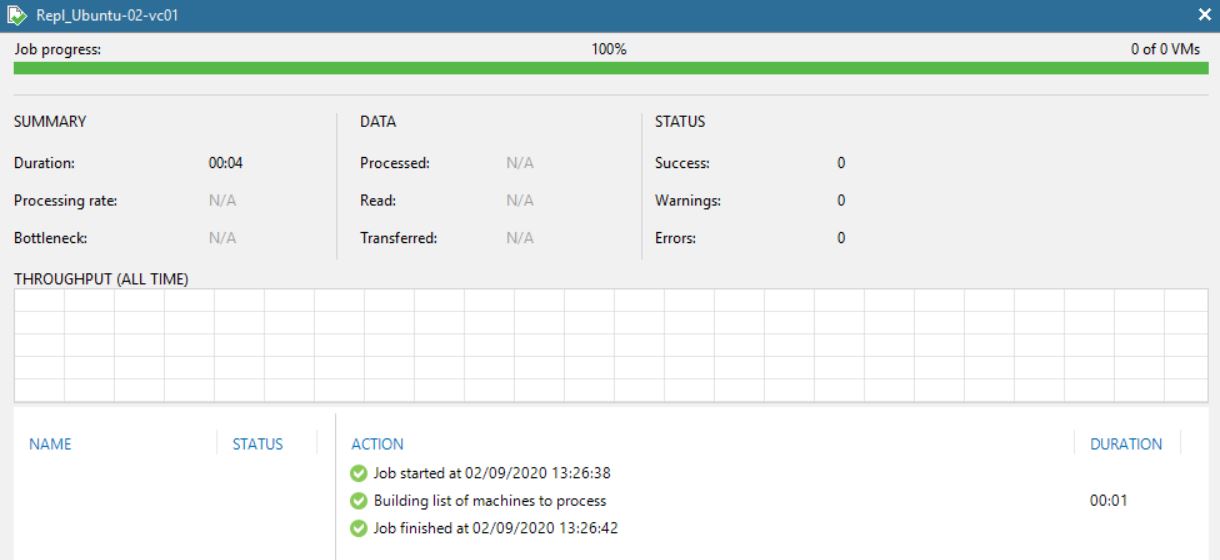 Picture 16
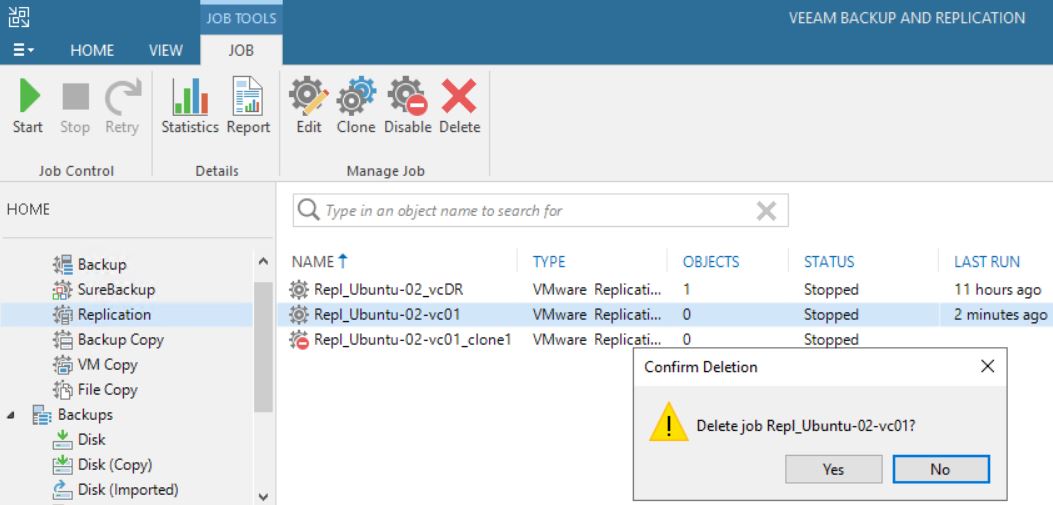 Picture 17
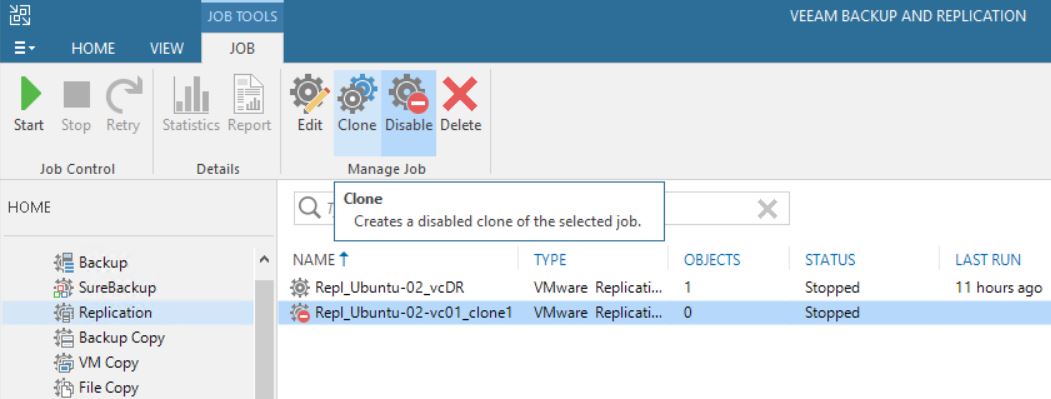 Picture 18
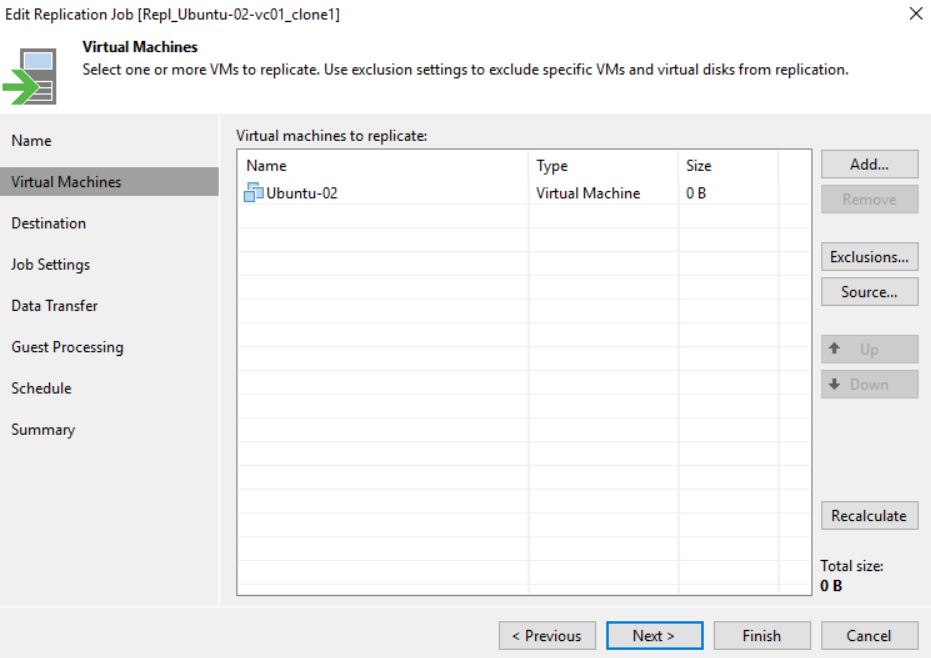 Picture 19
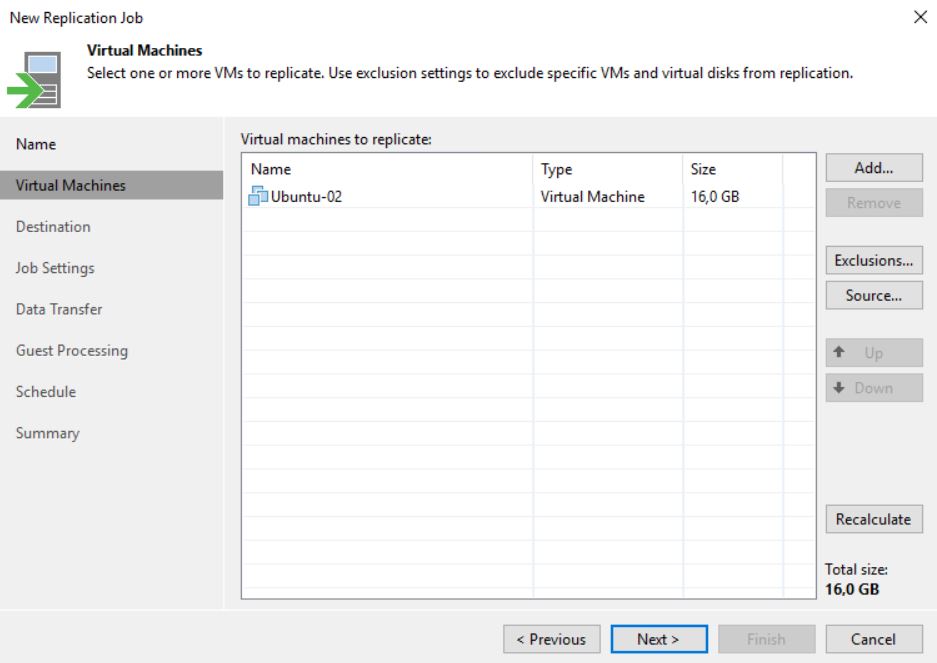 Picture 1
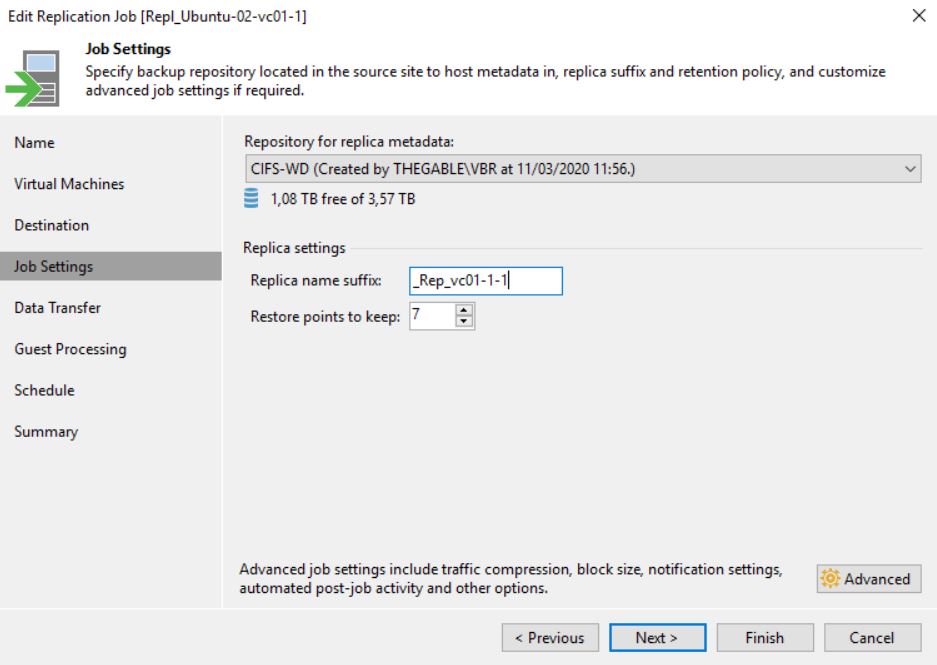 Picture 2
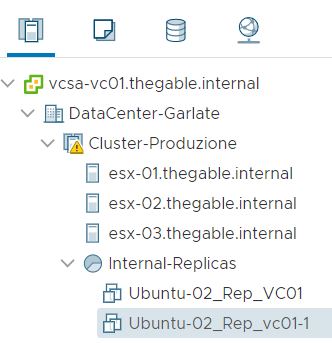 Picture 3
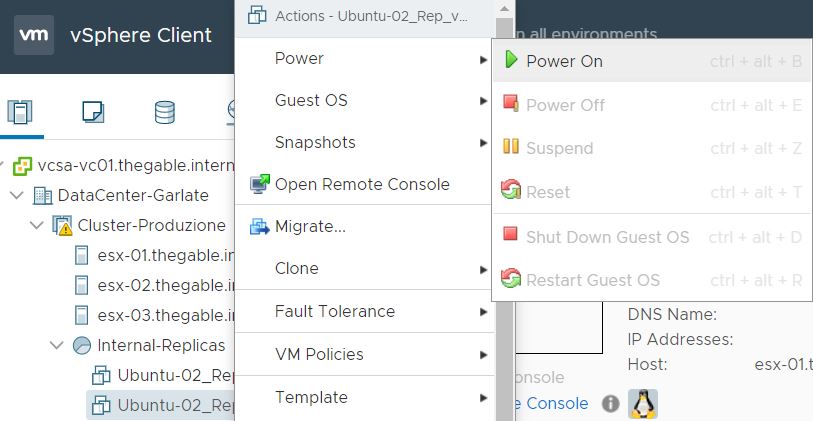 Picture 4
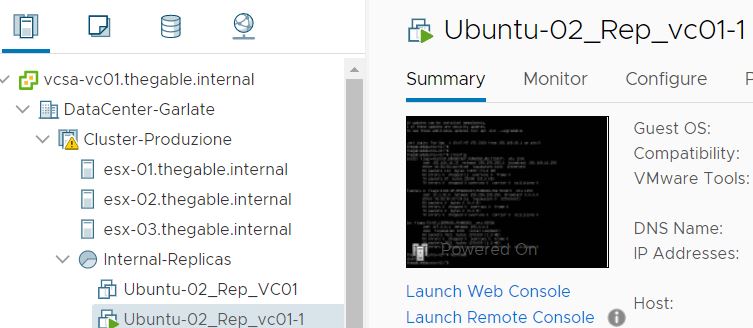 Picture 5
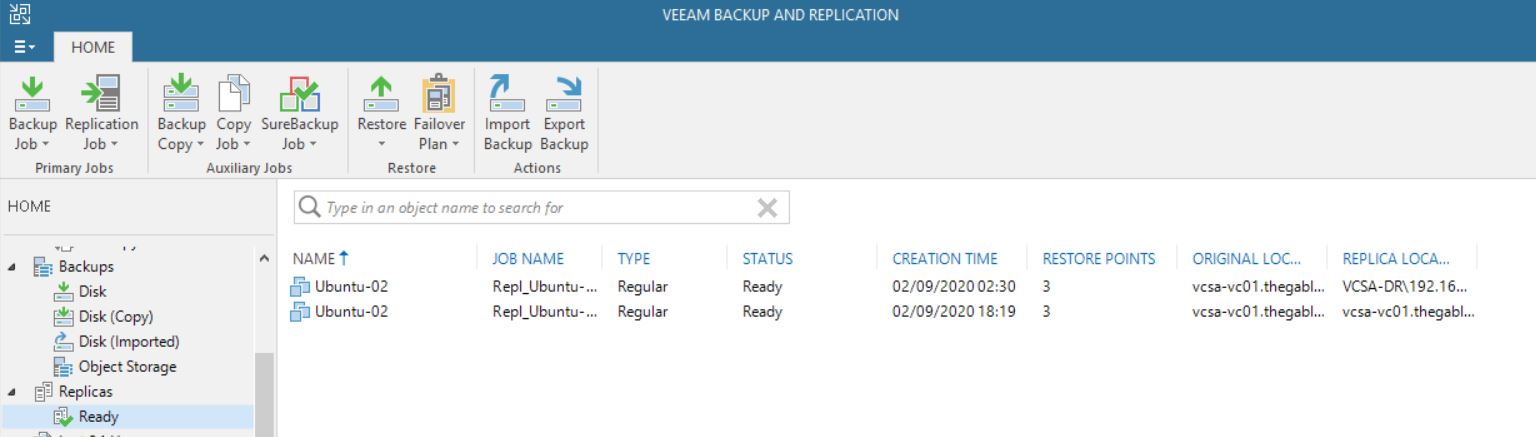 Picture 6
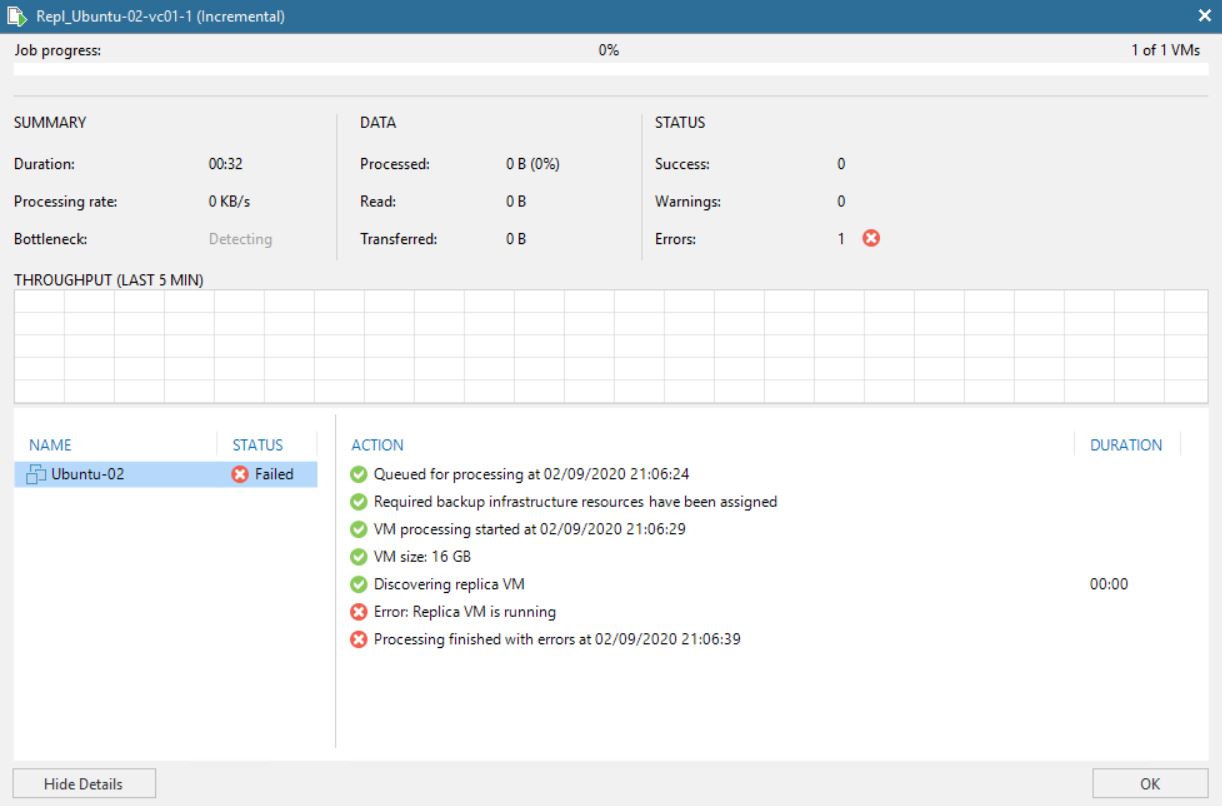 Picture 7
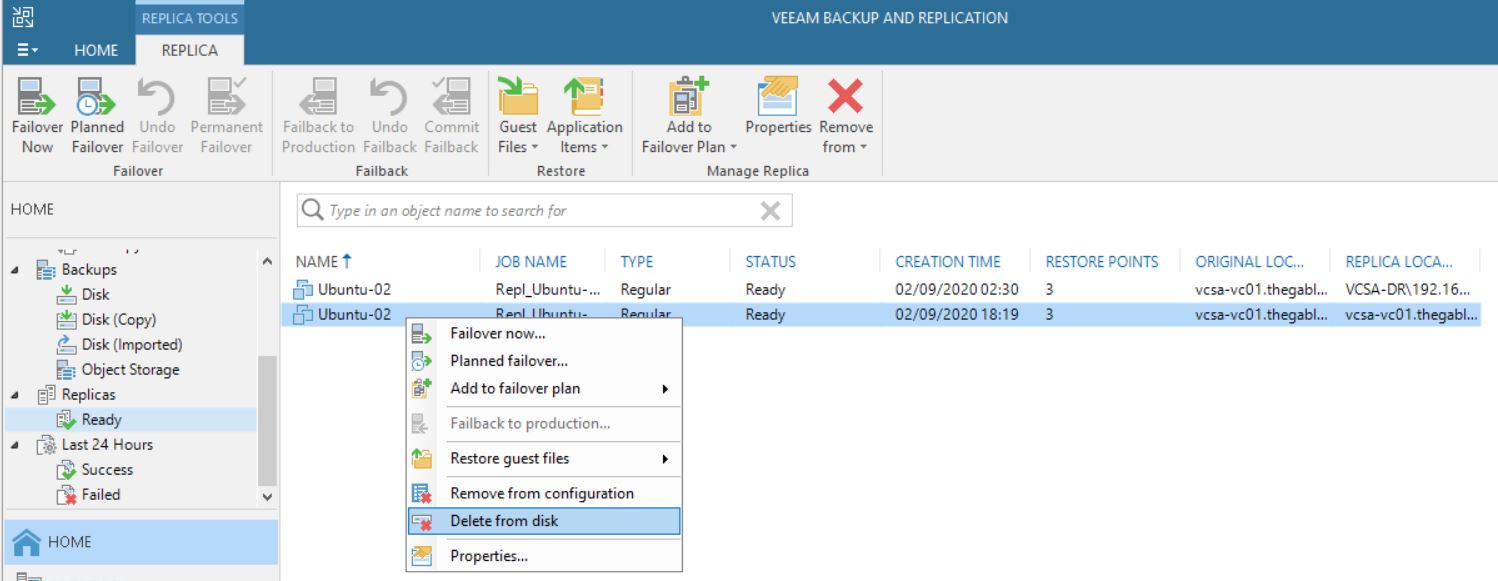 Picture 8
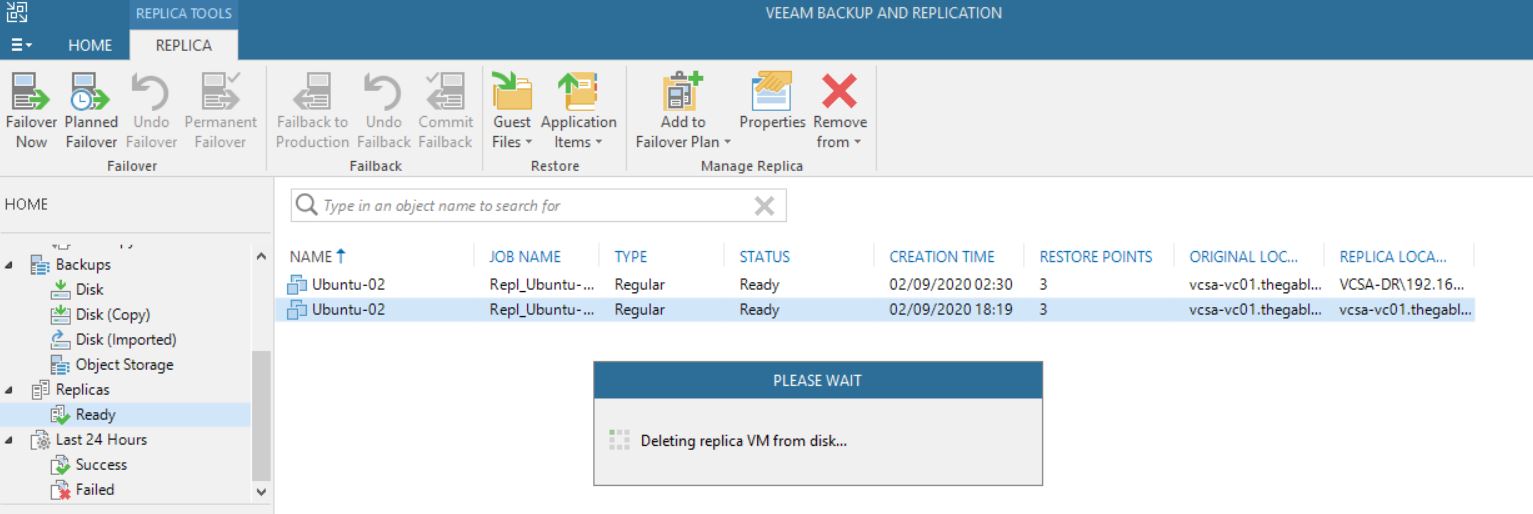 Picture 9
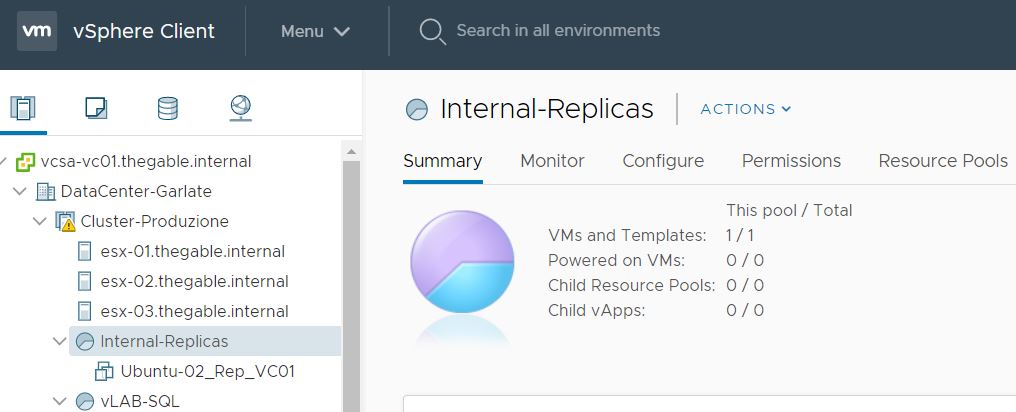 Picture 10
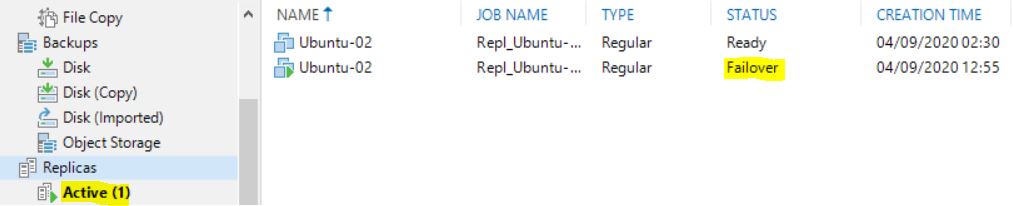 Picture 11
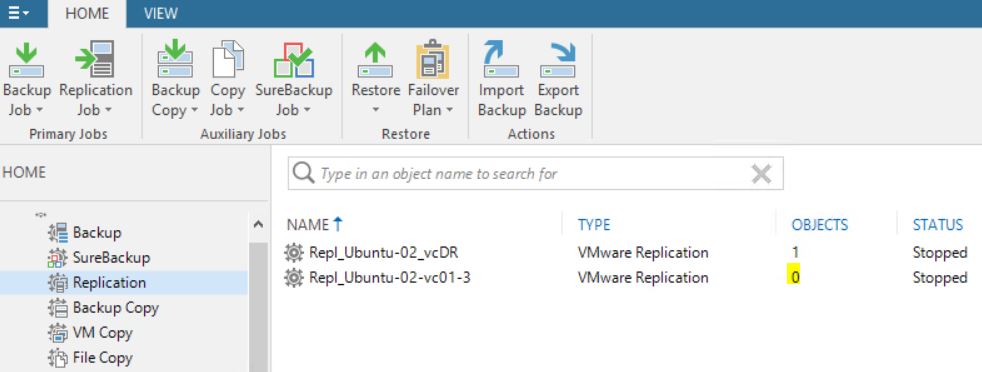 Picture 12
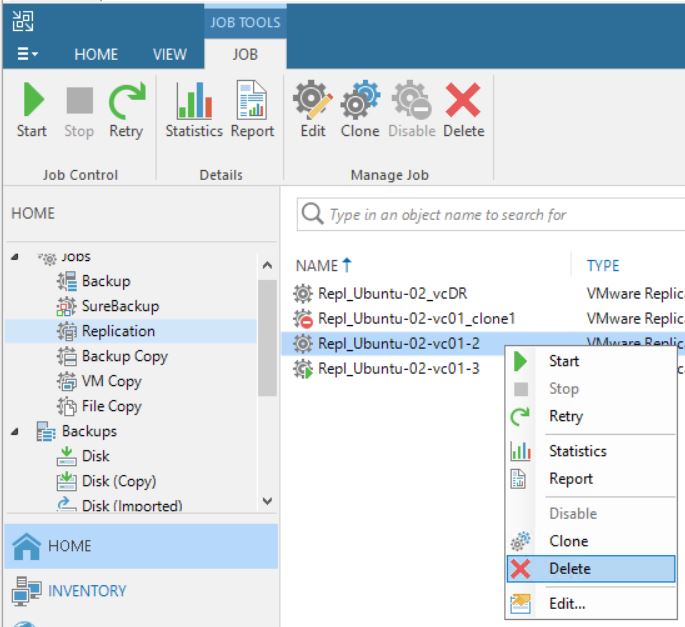 Picture 13
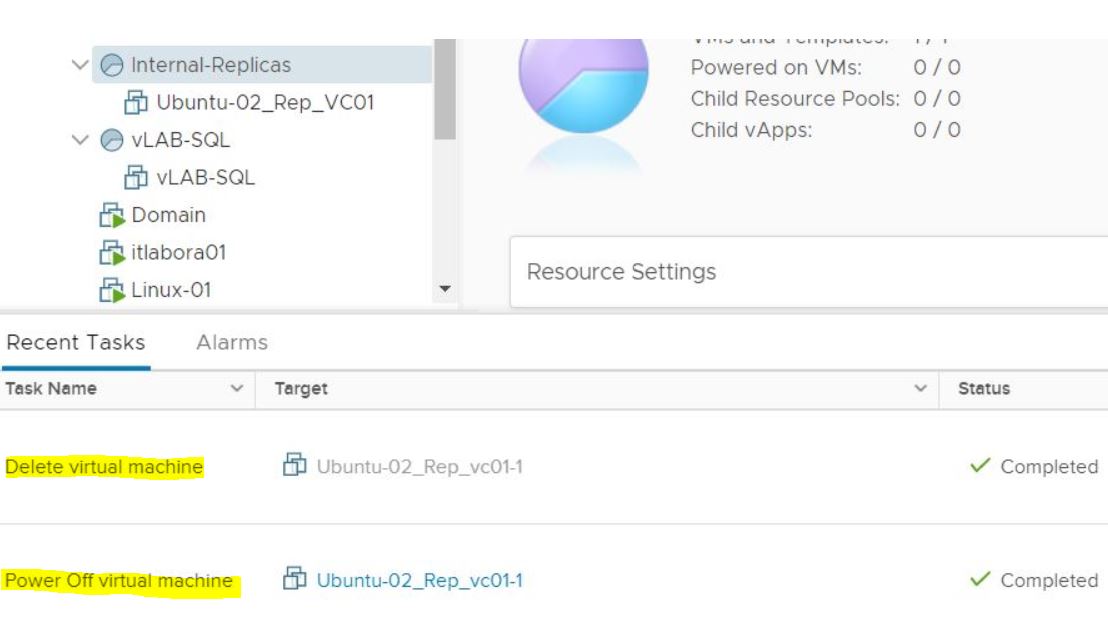 Picture 14
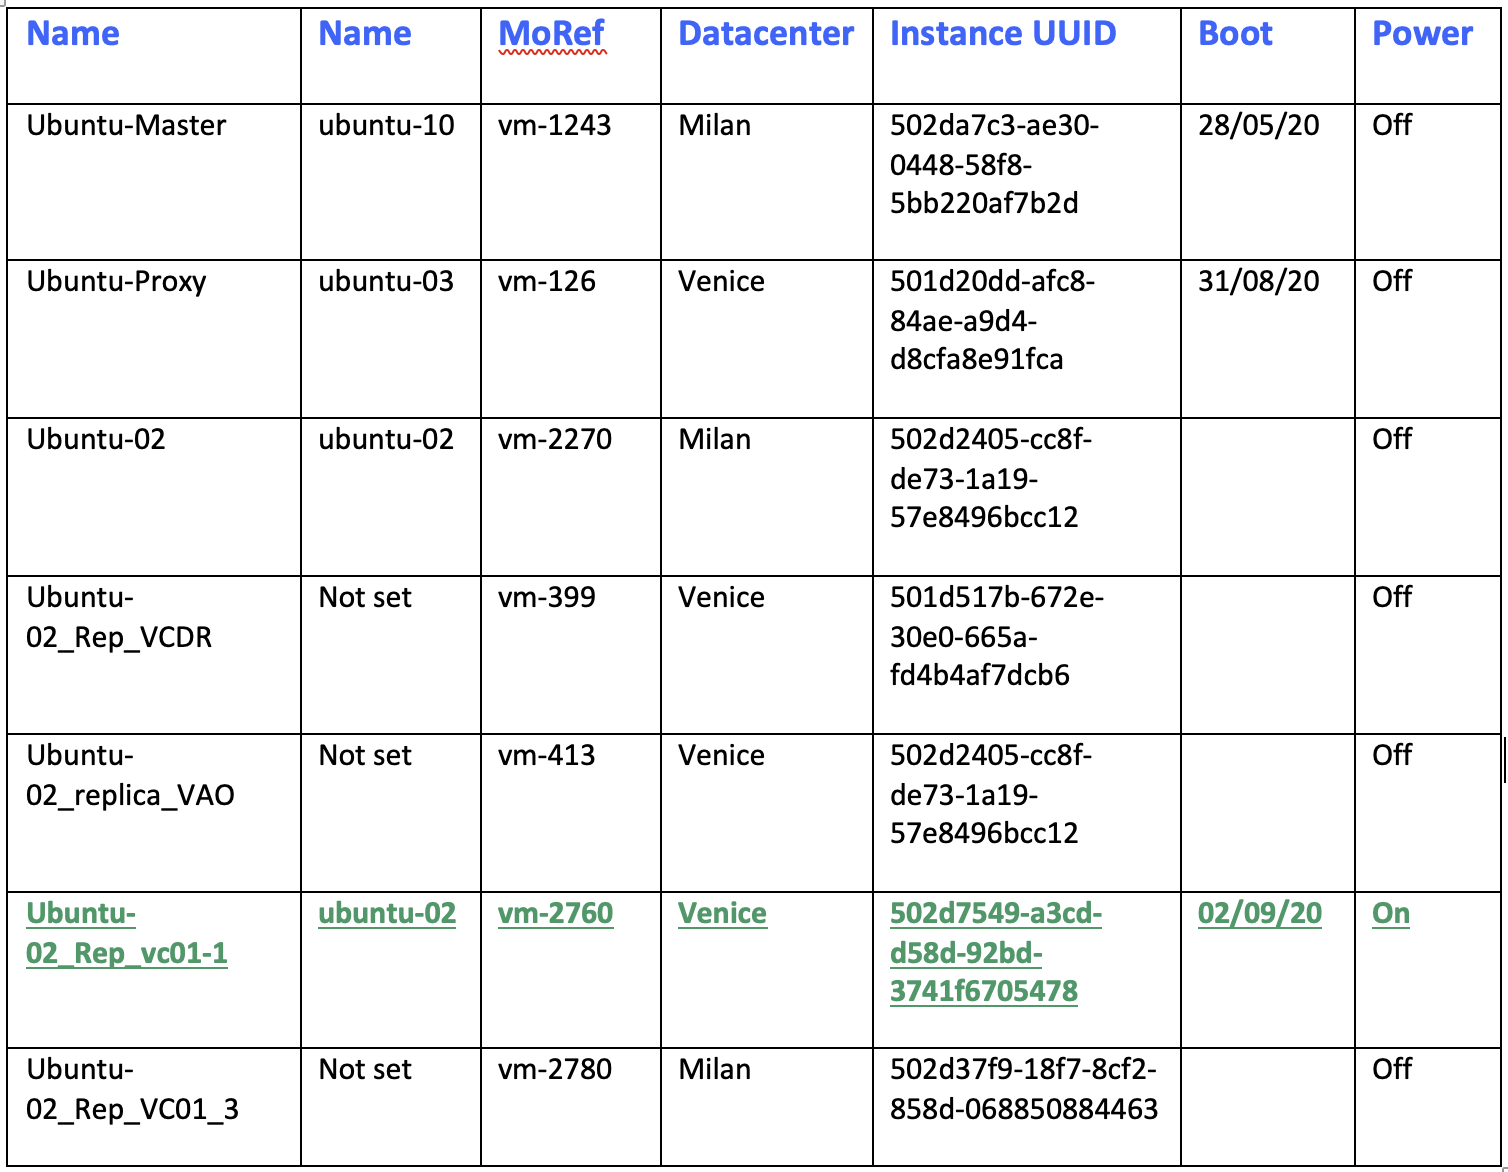 Table 1
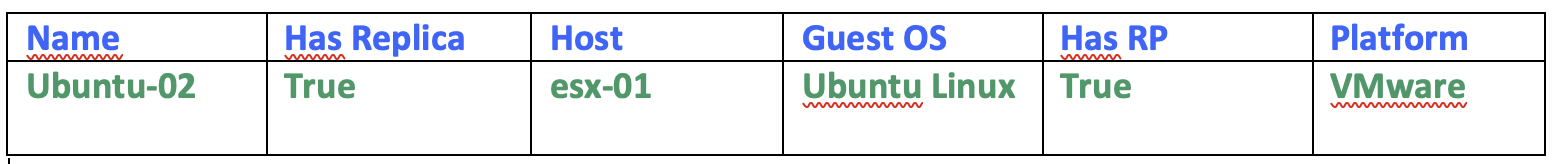 Table2
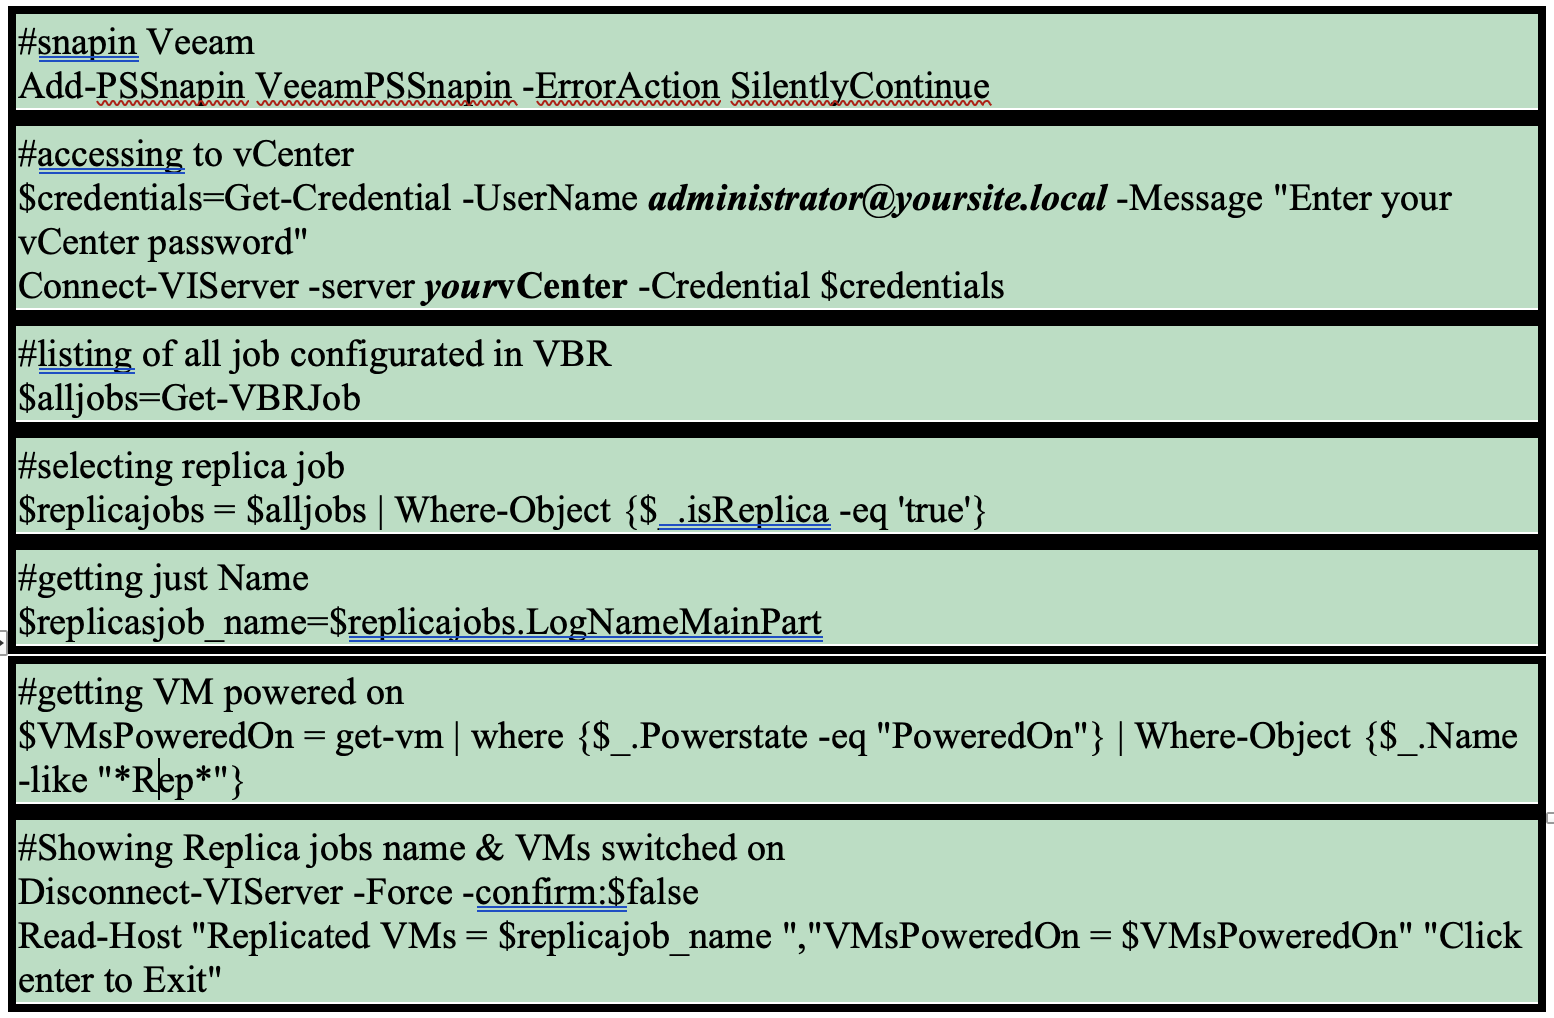

 Picture 1
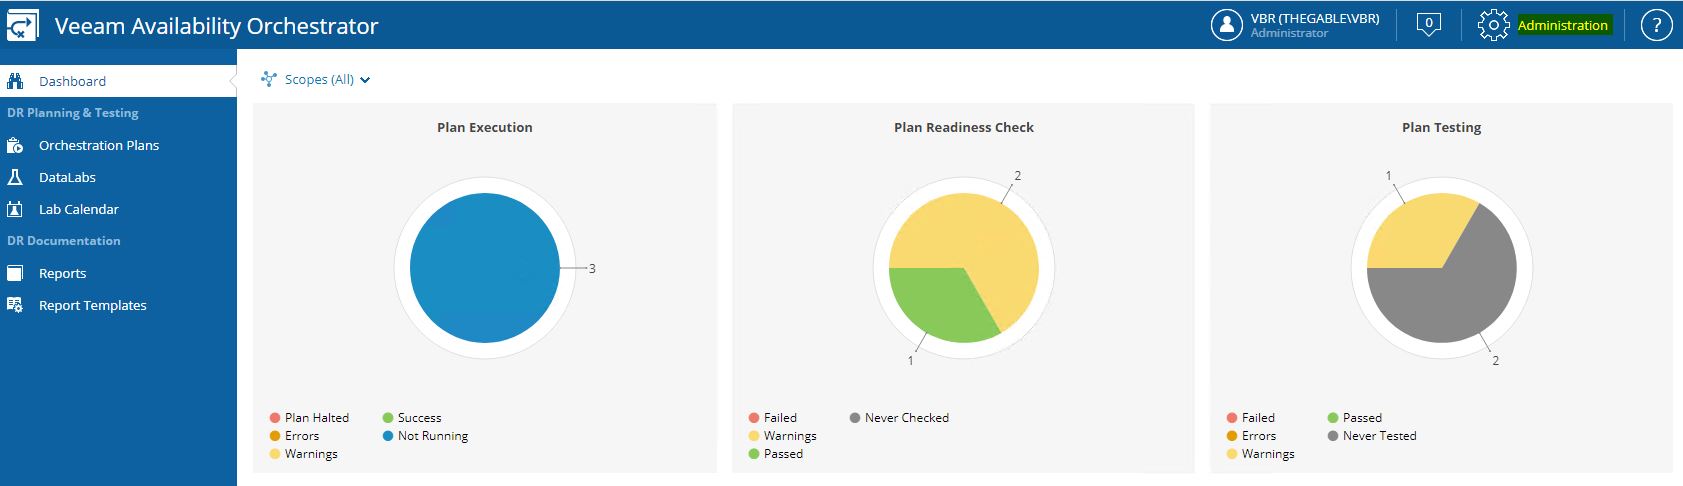 Picture 2
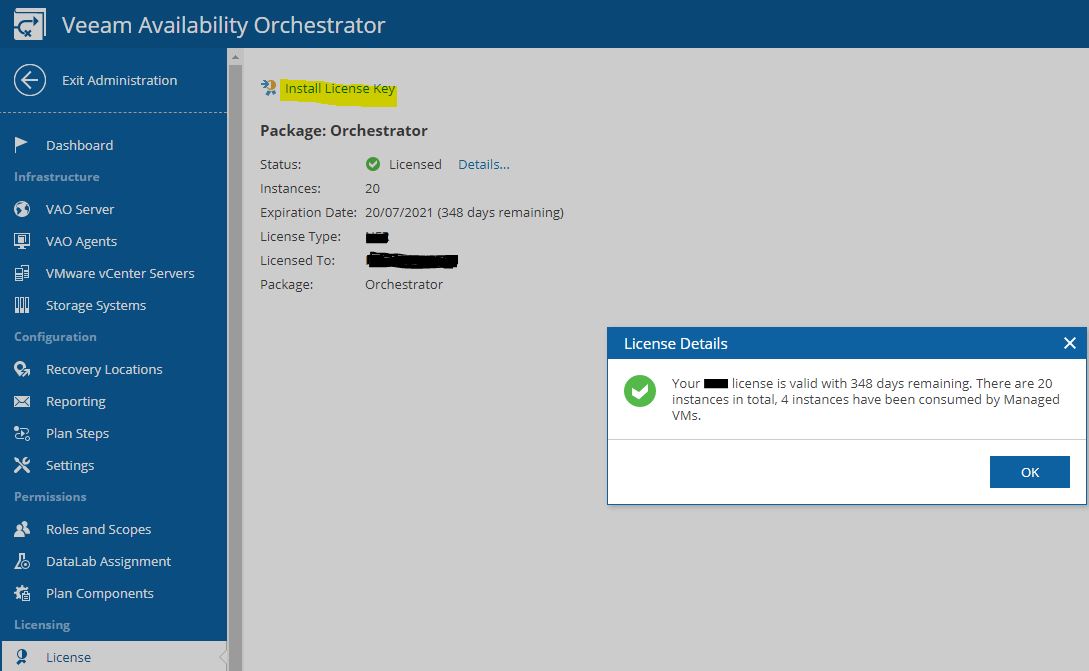 Picture 3
 Picture 4
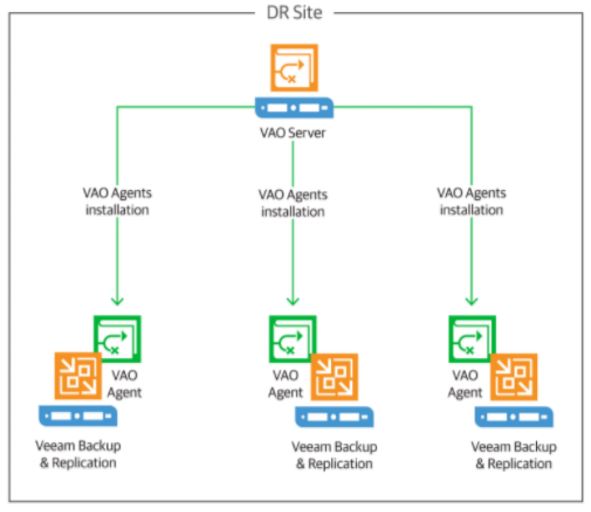 Picture 5
 Picture 6
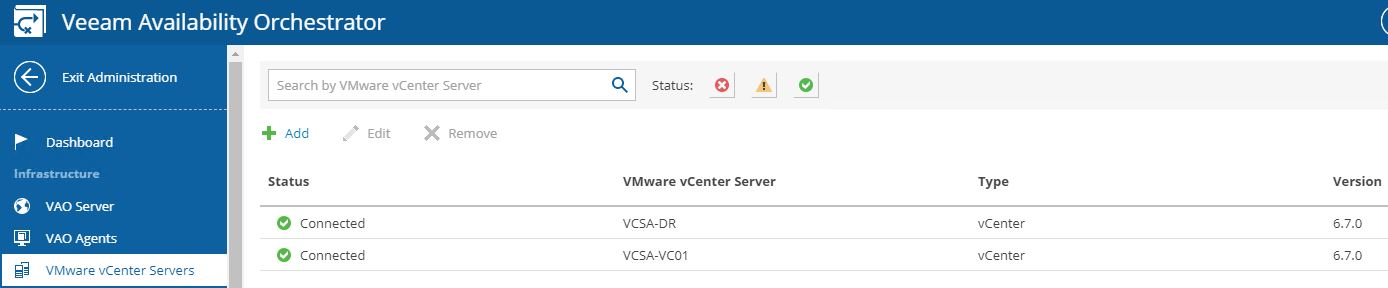 (Picture 7)
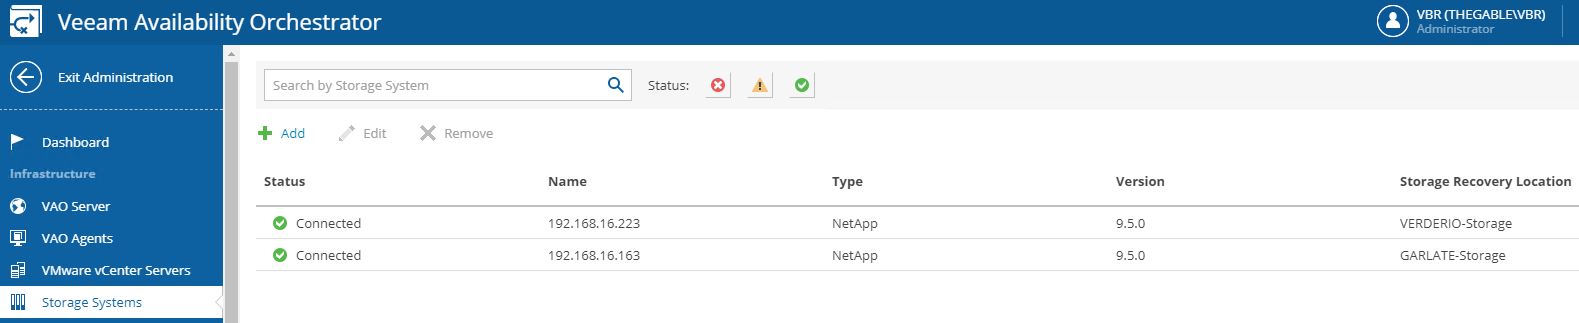 Picture 8
 Picture 9
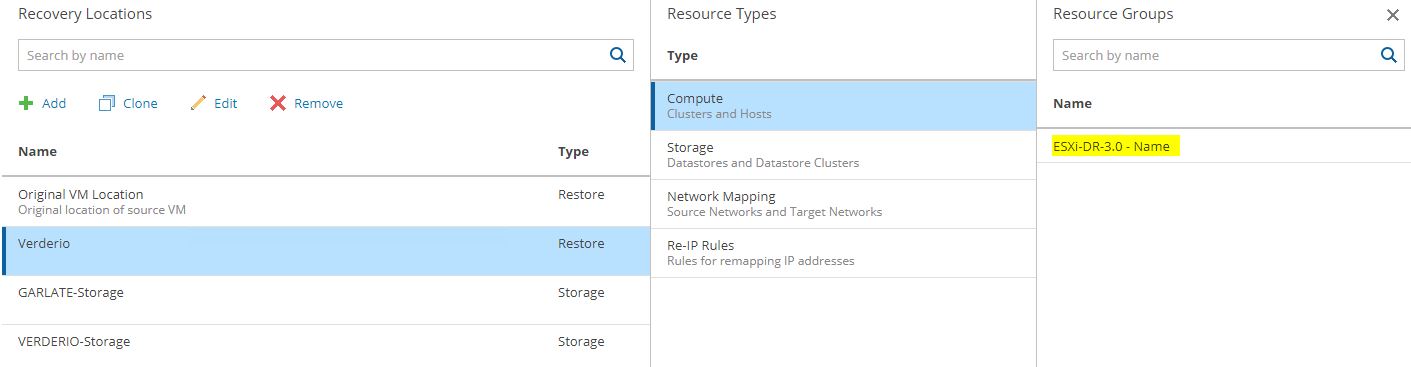 Picture 10
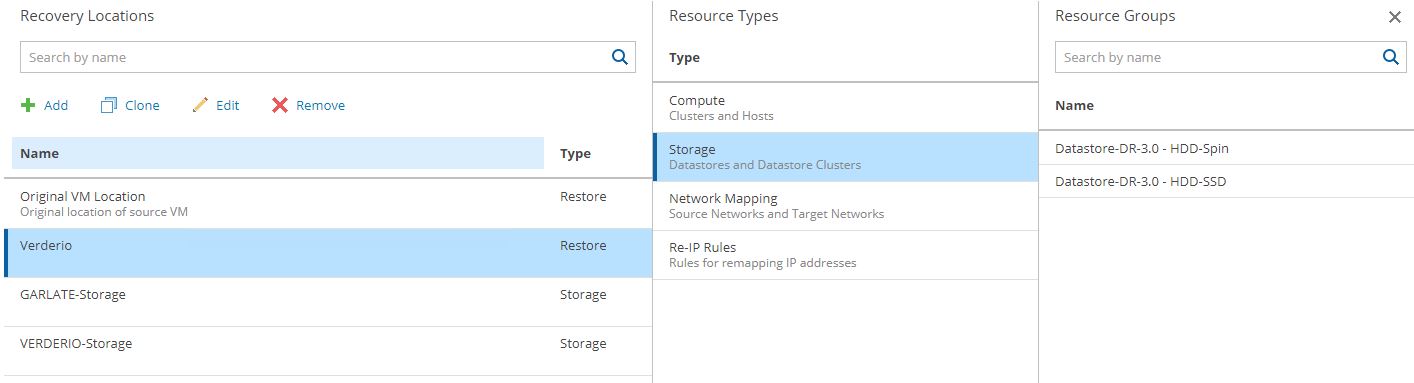 Picture 11
 (Picture 12)
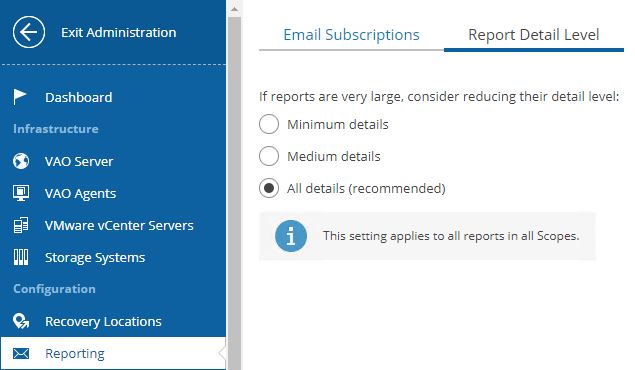 (Picture 13)
 (Picture 14)
 (Picture 15)
 Picture 16
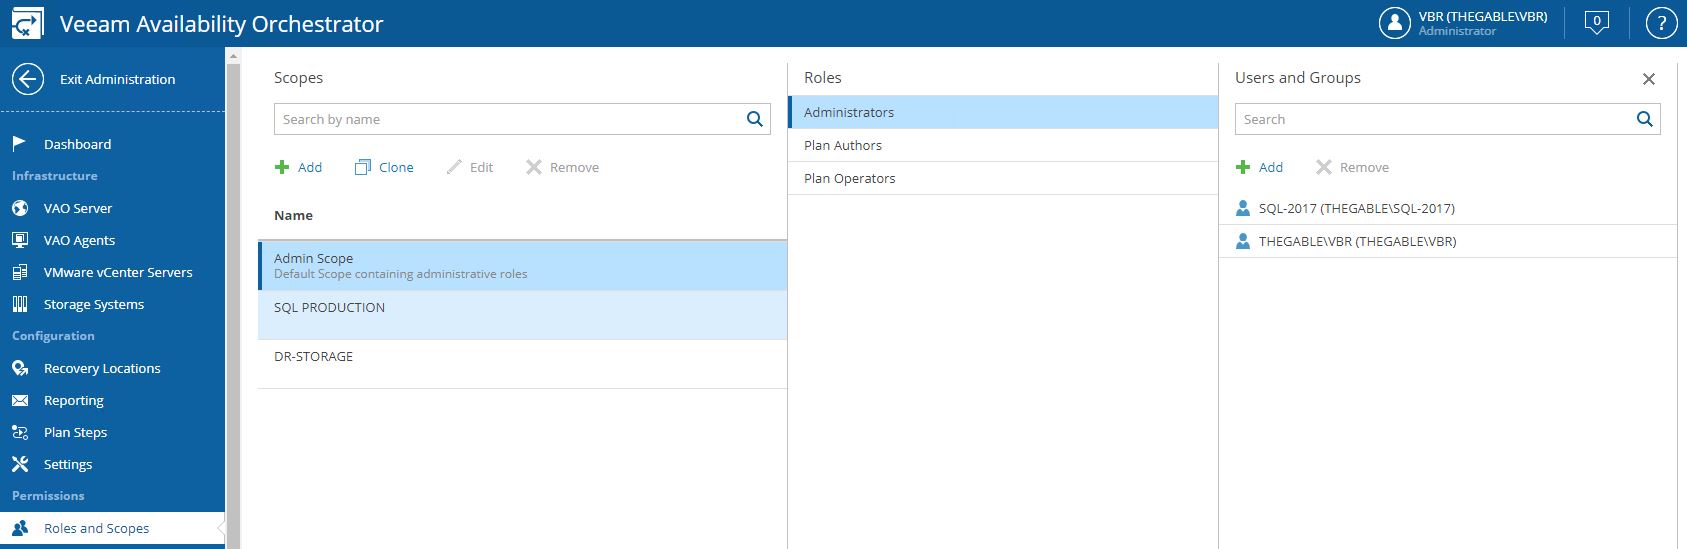 Picture 1
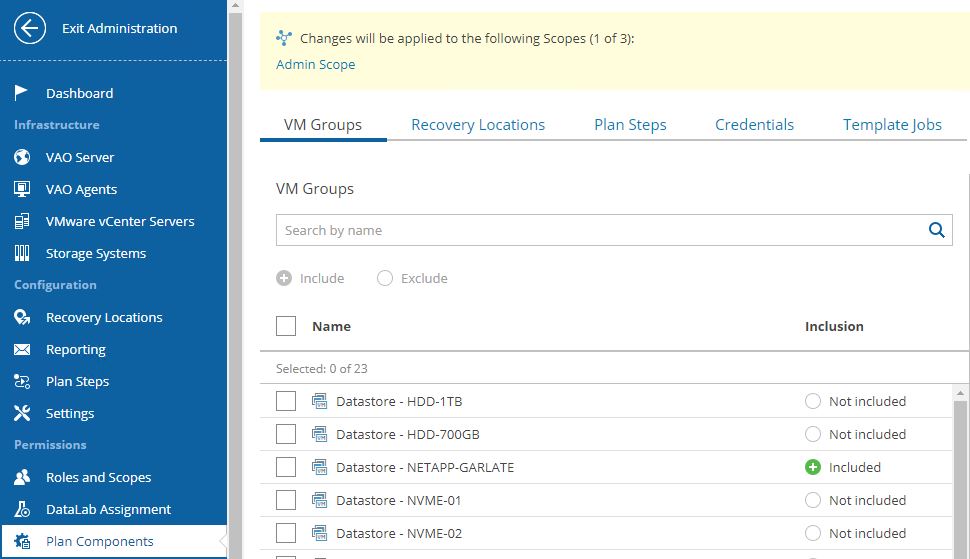
 Picture 4