In previous articles we have seen some details of how the Kubernetes architecture is built.
Today the working mechanisms of the Kubernetes engine will be described indicating the name of each component; to remain faithful to the comparison of the car engine, we will speak of the camshafts,valves,bearings, … that belong to the Cloud Native
Note 1: The installation of k8s in Datacenter, Cloud, and Laboratory will not be discussed, the network has already made comprehensive tutorials available.
To familiarize yourself with k8s I recommend using Minikube (Linux platform) Docker Desktop (Windows & Mac platform).
Let’s begin!
Kubernetes Master:It is the main node of the cluster on which three processes that are vital for the existence of the cluster run.
kube-apiserver
kube-controller-manager
Kube-scheduler
In the master node, there is also the DataBase etcd, which stores all configurations created in the cluster.
The nodes that take care of running the applications and therefore the services are said worker node. The processes present on the worker node I’m:
Kubelet
kube-proxy
kubectl : AND’ The official Kubernetes client ( CLI ) through which you can manage the cluster ( Kube-apiserver ) using the API.
Some simple examples of kubectl commands are:
kubectl version (indicates the version of k8s installed)
kubectl get nodes (find out the number of nodes in the cluster)
kubectl describe nodes nodes-1 (shows the health status of the node, the platform on which k8s is running (Google, AWS, ….) and the allocated resources (CPU, RAM)).
Kube-Proxy : He is responsible for managing networking, from Routing to Load Balancing rules.
Note 2 : K8s will try to use them all libraries available at the level of operating system .
Container Runtime : It is the foundation on which the k8s technology rests.
kubernetes supports several runtimes among which we remember, container-d , cri-o , rktlet .
Note 3 : The runtime Docker it has been deprecated in favor of those that use interfaces CRI ; Docker images will still continue to work in the cluster.
The objects Kubernetes base are:
Pod
Services
Volumes
Namespace
THE controller provide additional functionality and are:
ReplicaSet
Deployment
StatefulSet
DaemonSet
Job
Between Deployment it is imperative to mention Kube-DNSwhich provides name resolution services. Since kubernetes version 1.2 the name has changed to Core-dns.
Add-On : they are used to configure further cluster functions and are placed inside the name space kube-system (such as Kube-Proxy, Kube-DNS, kube-Dashboard)
Add-ons are categorized according to their use:
Add-on of Netwok policy . (For example the NSX-T add-on takes care of the communication between the K8s environment and VMware)
Add-on Infrastructural (For example KubeVirt which allows connection with virtual architectures)
Add-on of Visualization and Control (For example Dashboard a web interface for K8s).
For commissioning, Add-ons use controllers DaemonSet And Deployment .
The image in figure 1 summarizes what has just been explained.
A good way to describe cloud-native environments is to refer to the image of your car.
The container is the engine, k8s is the electronic control unit that manages the proper functioning of the vehicle, the drivers, indicating the route and the destination, select the type of service to be provided.
Today’s article will reveal some architectural details to understand how “the car” manages to reach its destination in an efficient way.
Containers are of two types:
The first is called System Container. It is the bodywork of the car (I mean from the plates to seats, steering wheel, gear lever and accessories).
Often for simplicity of creation, it is a Virtual Machine (VM) with Linux operating system (it can also be Windows).
The most common services present in the VM are ssh , cron and syslog , the File System is of type ext3, ext4, etc.
The second type is called ApplicationContainer and is the place where the image will carry out the activities.
Note1: The image is not a single large file. They are usually multiple files which, through an internal cross-pointing system, allow the application to operate correctly.
The Container application (from now on container only), has an operating mode based on a rigid logic, where all levels (layers) have the peculiarity of communicating with each other and are interdependent.
Figure 1
This approach is very useful as it is able to manage the changes that may occur over time in an effective and hierarchical way.
Let’s take an example: When a service configuration change occurs, for which Layer C is updated, Layer A and B are not affected, which means that they must NOT be modified in turn.
Since Developers like to refine their own images (program files) rather than dependencies, it makes sense to set the service logic in the mode indicated in figure 2 where the dependencies are not affected by a new image.
Figure 2
Note2 : The File system on which the images are placed (in the example of the car engine we are talking about pistons, connecting rods, shafts …) is mainly of three different types:
Overlay
Overlay 2
AUFS
Note3 : A good advice on the security side is not to build the architecture so that the passwords are contained in the images ( Baked in – Cooked)
One of the splendid innovations introduced in the container world is the management of images:
In a classic high-reliability environment, the application is installed on every single node of the cluster.
In containers, the application is downloaded and deployed only when the workload requires more resources than a new cluster node with a new image.
For this reason, the images are saved in “virtual” warehouses, which can be local or distributed on the internet. They are called “Register Server”.
The most famous are Docker Hub, Google Container Registry, Amazon Elastic Container Registry, Azure Container Registry.
We conclude this article by talking about the management of resources associated with a service.
The container platform uses two features called Cgroup and NameSpace to allocate resources that work at the kernel level.
The purpose of the Cgroup is to assign the correct resources ( CPU & RAM ).
Name spaces have the purpose of grouping the different processes and making sure that they are isolated from each other ( Multitenancy ).
The type of NameSpace can affect all the components of the service as indicated in the list below.
Cgroup
PID
Users
Mount
Network
IPC (Interprocess communication)
UTS (allows a single system to appear with different host and domain names and with different processes, useful in case of migration)
An example of limiting the resources of an application is shown in Figure 3 where thegable image, downloaded from the Register Server grcgp, has a limit of RAM and CPU resources allocated.

 Figure 1
 Figure 2
 Figure 3
 Figure 4
 Figure 5
 Figure 6
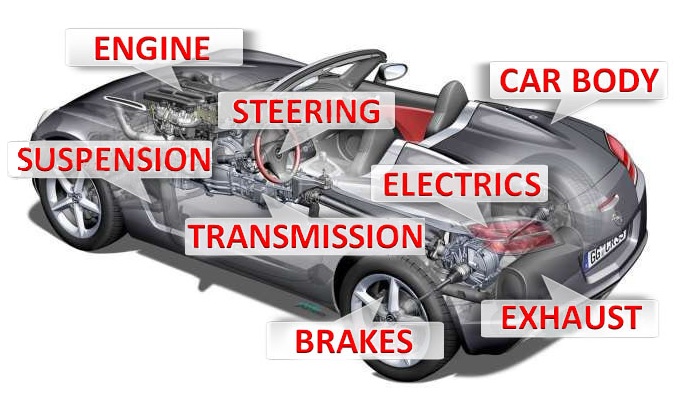
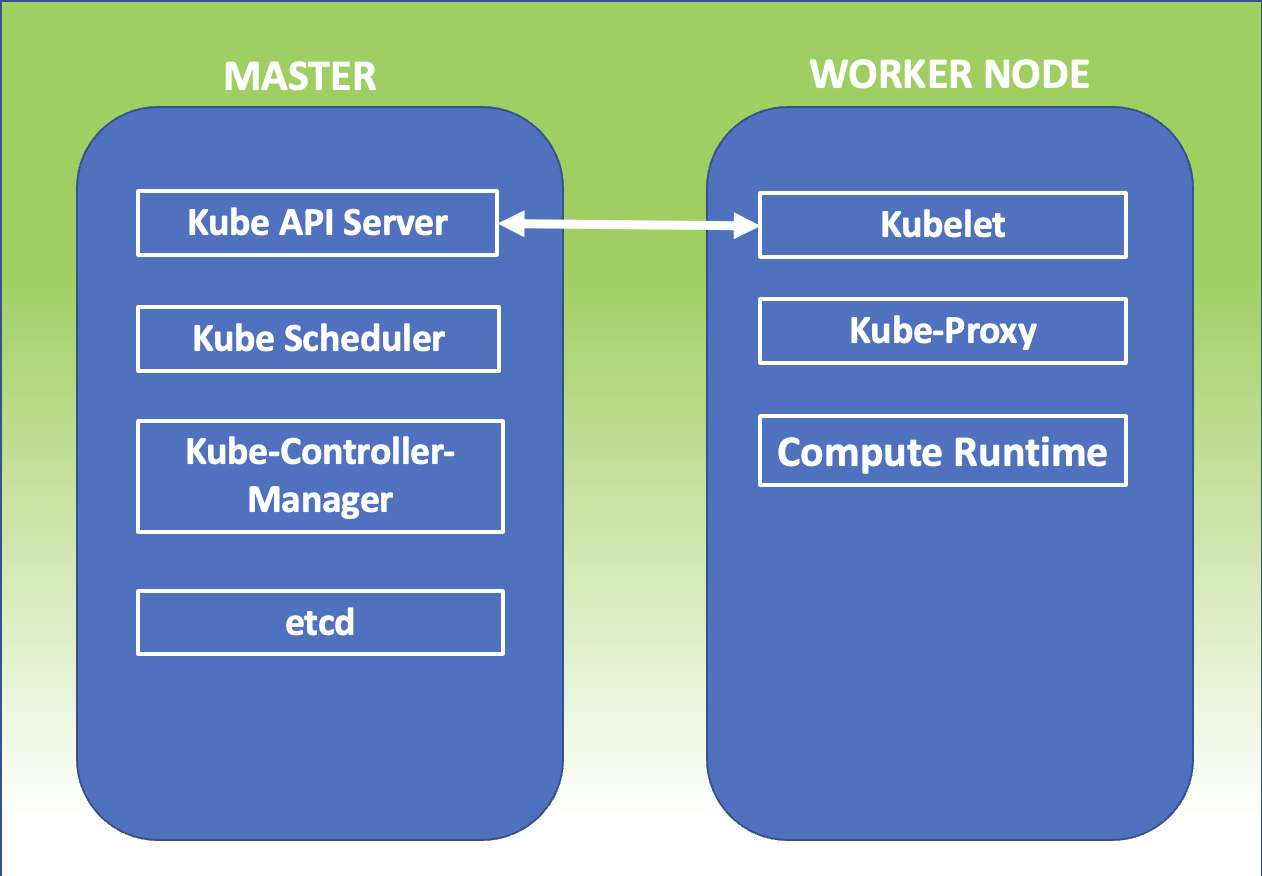 Figure 1
 Figure 1
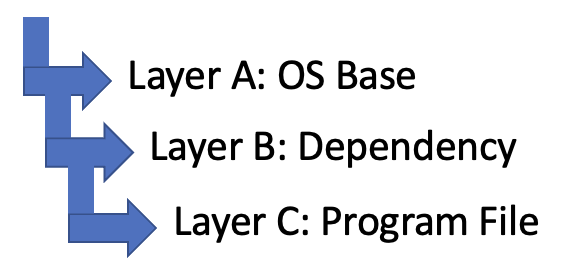 Figure 2
 Figure 3