
We resume the journey started in the past months on the Cloud-Native approach to show with a real case how flexible and powerful Kubernetes technology turns out to be.
To this end, the article will illustrate how to implement a dashboard capable of monitoring a k8s architecture in a few steps.
The project consists of two phases:
- Creation of the Dashboard service
- Web-browsing access to the Dashboard
1. Service creation: In the k8s world, the deployment of a service is done through the use of descriptive files with a YAML extension. It is an approach called declarative that has the imperative as its alter ego.
In our scenario, it is sufficient to use the following command:
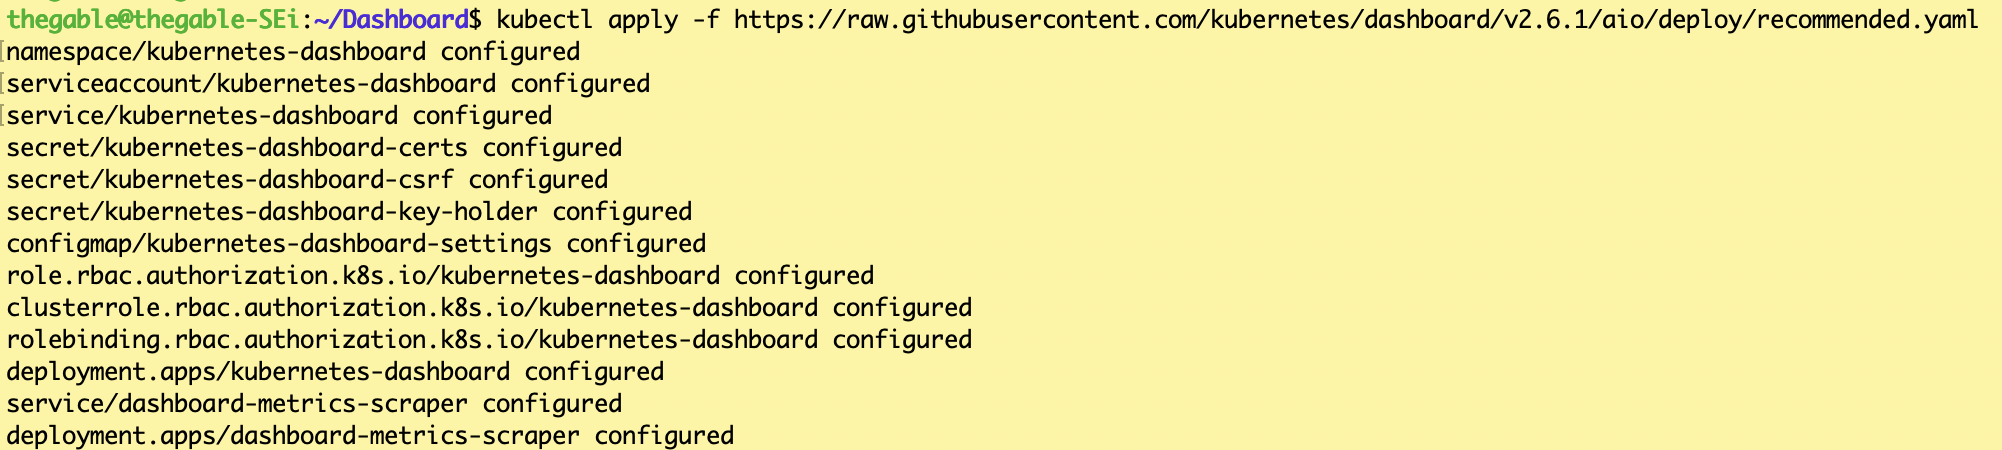
kubectl apply -f https://raw.githubusercontent.com/kubernetes/dashboard/v2.6.1/aio/deploy/recommended.yaml
Using the file found on GitHub recommended.yaml, the dashboard service is automatically created within a new namespace named Kubernetes-dashboard (see image 1).
 Picture 1
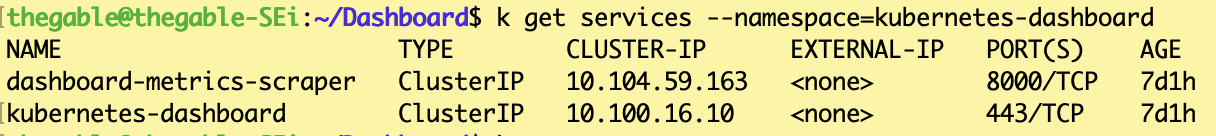
The command can be used to verify that the service is available:
kubectl get services –namespace=kubernetes-dashboard (see image 2)
 picture 2
2. Dashboard Access (via https)
In Kubernetes, access to available resources is based on RBAC (Role-Base access control), which defines the relationship between the user, the roles, and the resources within the organization.
Two YAML declarative files can be used for the Dashboard service:
(a) service-account.yaml (which defines permissions for resources in cluster/namespace)
(b) cluster-role-binding.yaml (defining users and/or service accounts)
Note1: Granting administrator privileges to the service account for Dashboard could pose a security risk. Ask your security team.
We are almost at the end, one last effort.
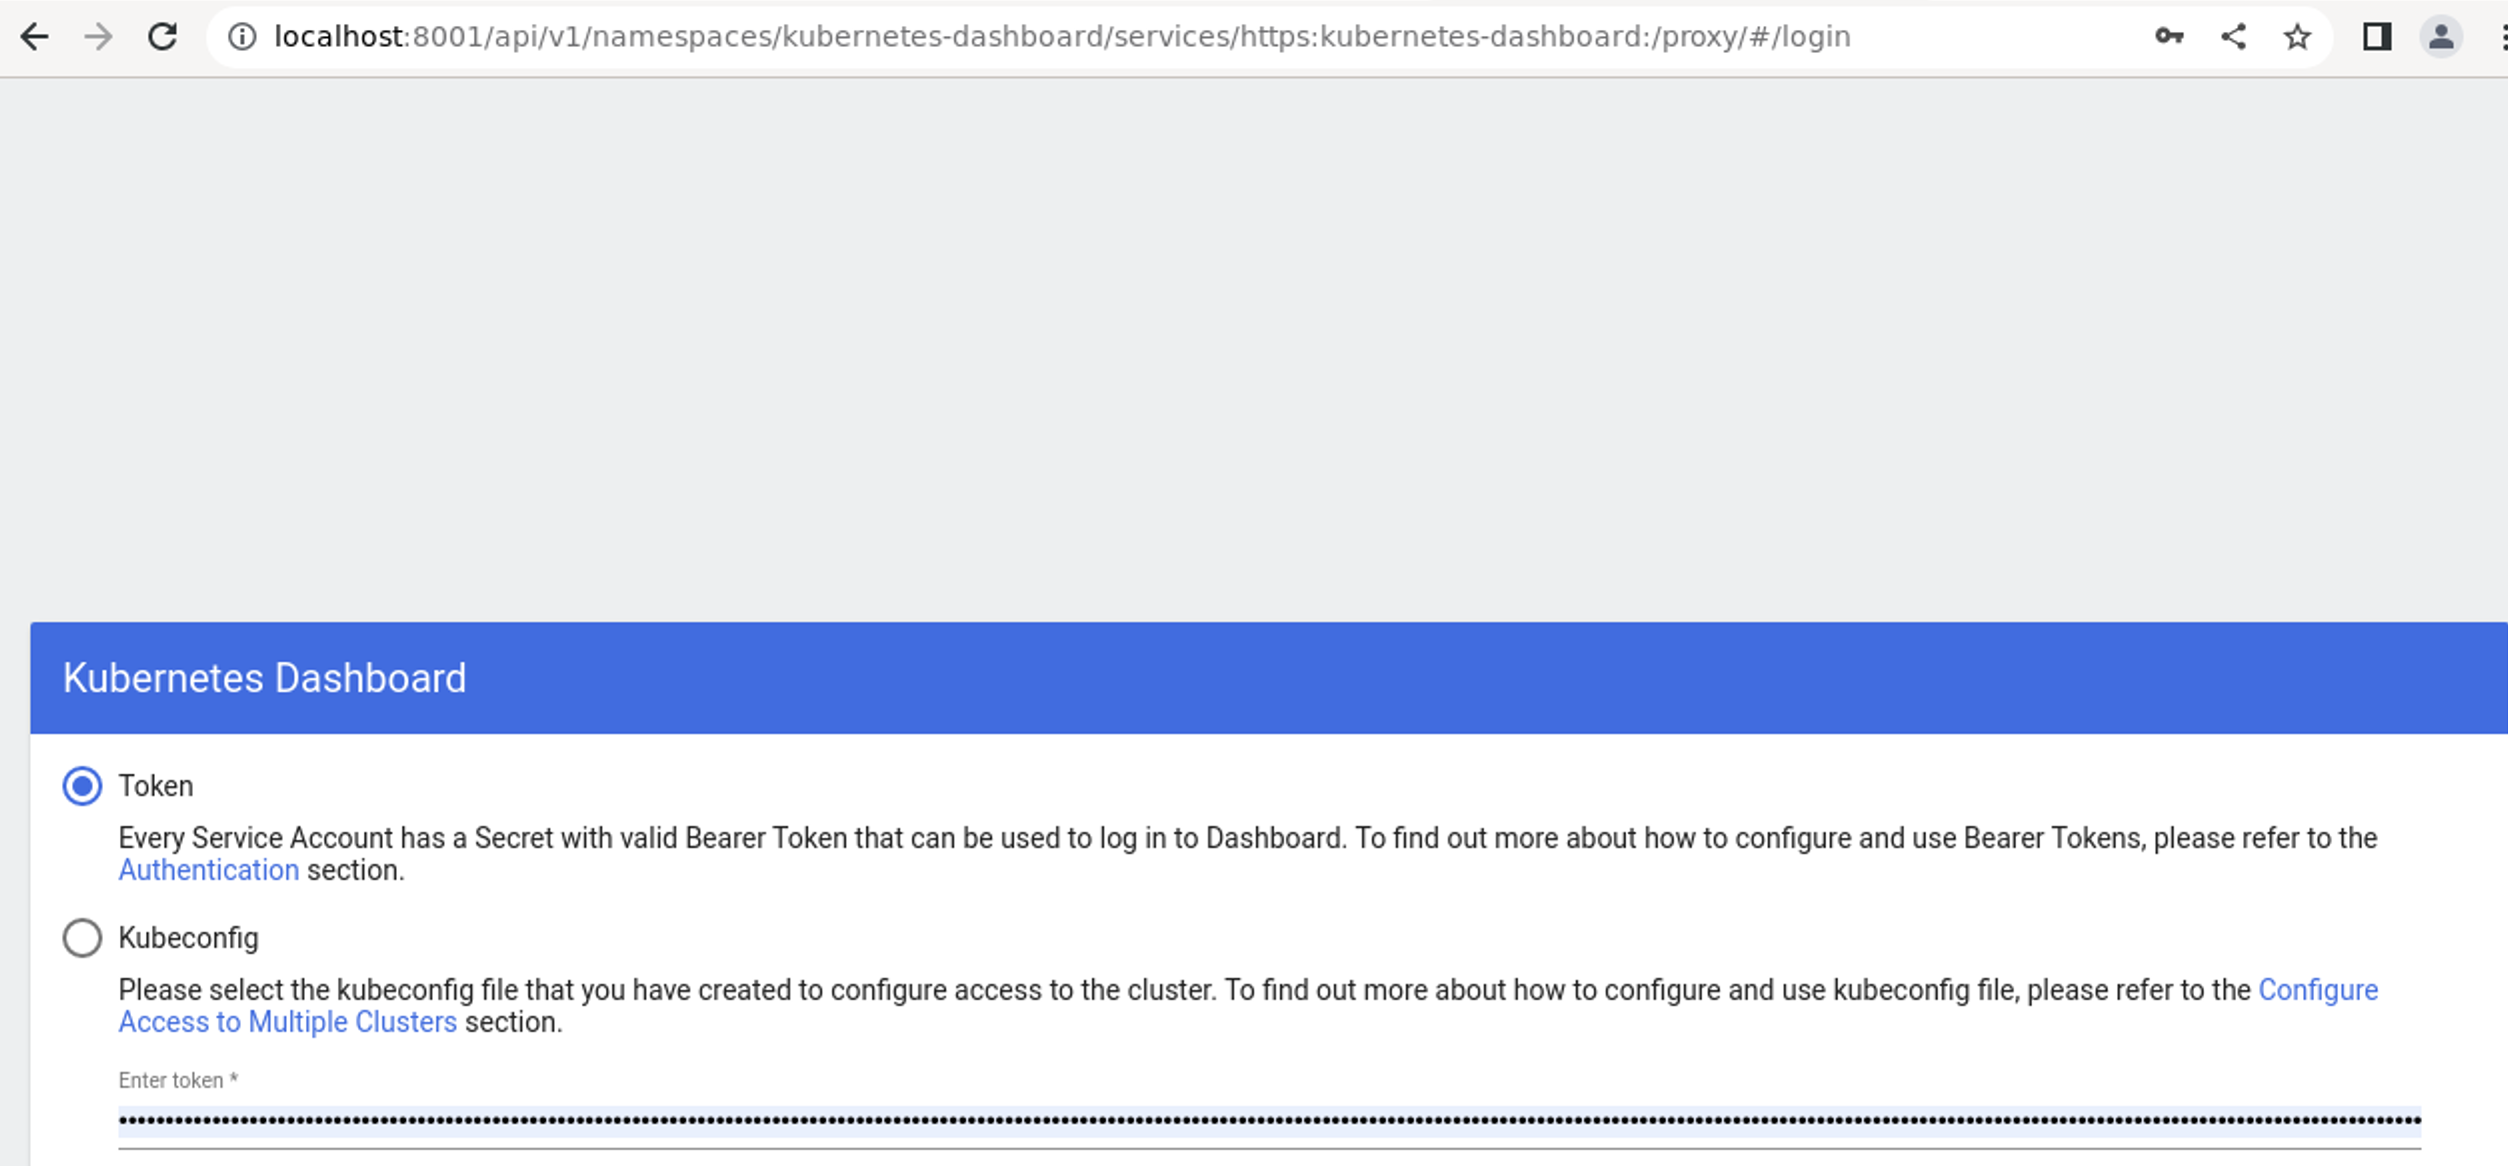
- With the command: kubectl proxy Dashboard is exposed via HTTPS to the address: http://localhost:8001/api/v1/namespaces/kubernetes-dashboard/services/https:kubernetes-dashboard:/proxy/.
- With the command kubectl -n kubernetes-dashboard create token admin-us the token authorizing the user to access the console is created (see image 3)
 Picture 3
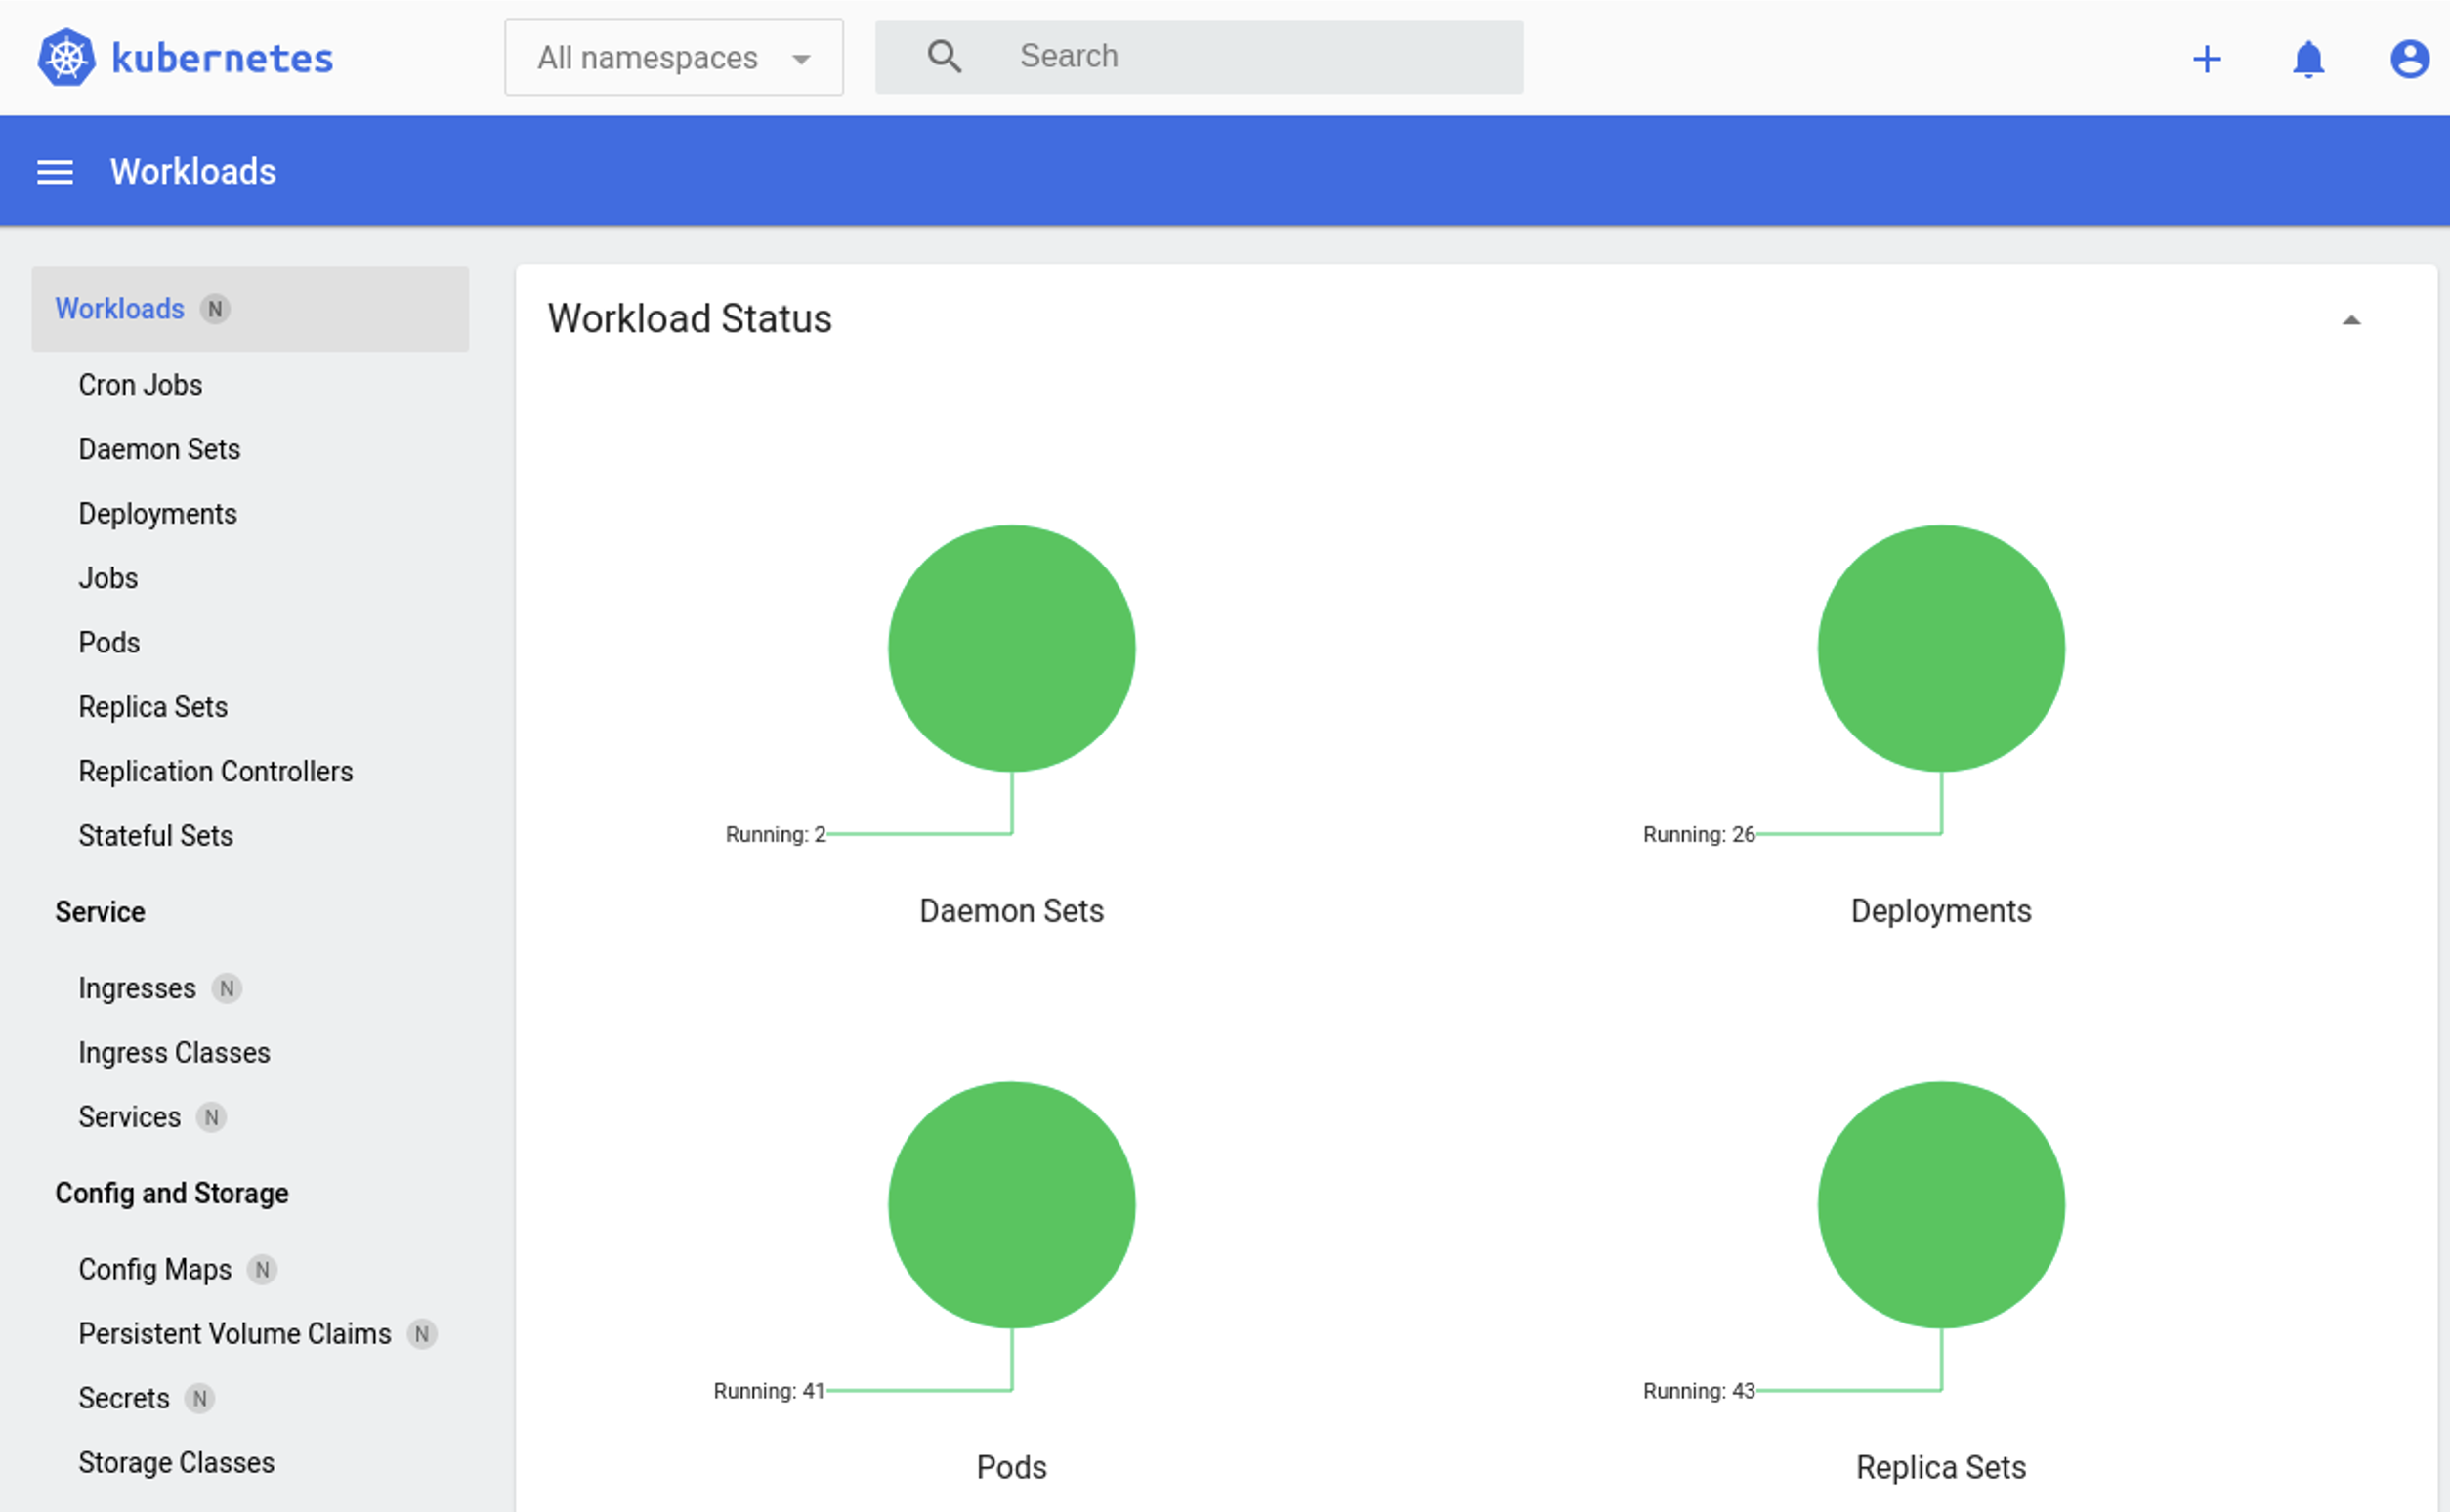
The result should be as shown in image 4.
 Picture 4
See you Soon!